. 2006 Jun;24(6):801-812.
doi: 10.1016/j.immuni.2006.04.008.

Toll-like receptors on hematopoietic progenitor cells stimulate innate immune system replenishment

Affiliations

Toll-like receptors on hematopoietic progenitor cells stimulate innate immune system replenishment

Yoshinori Nagai et al. Immunity. 2006 Jun.

Abstract

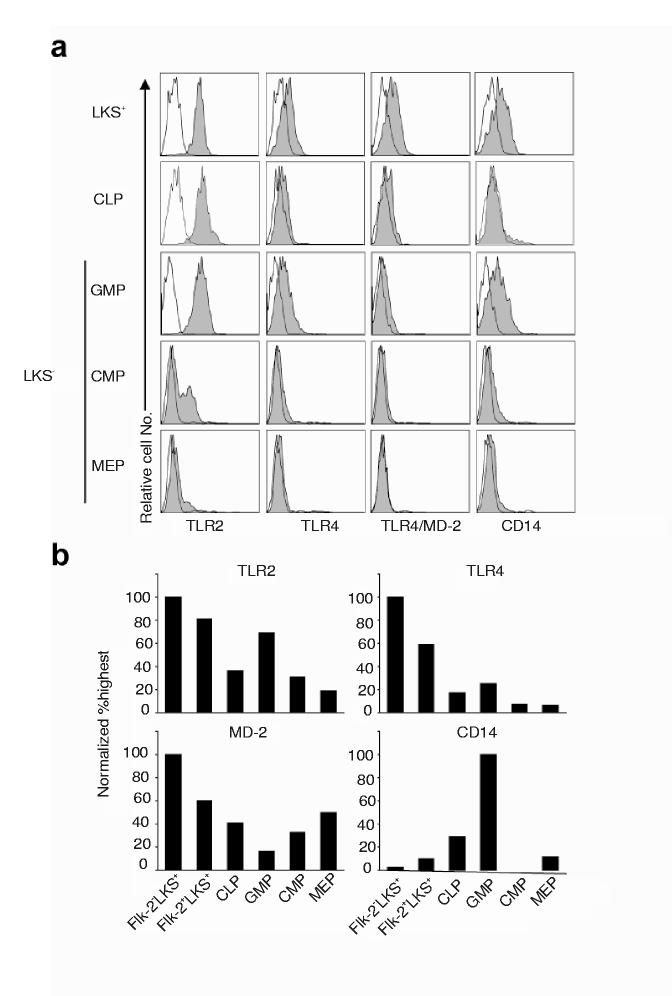
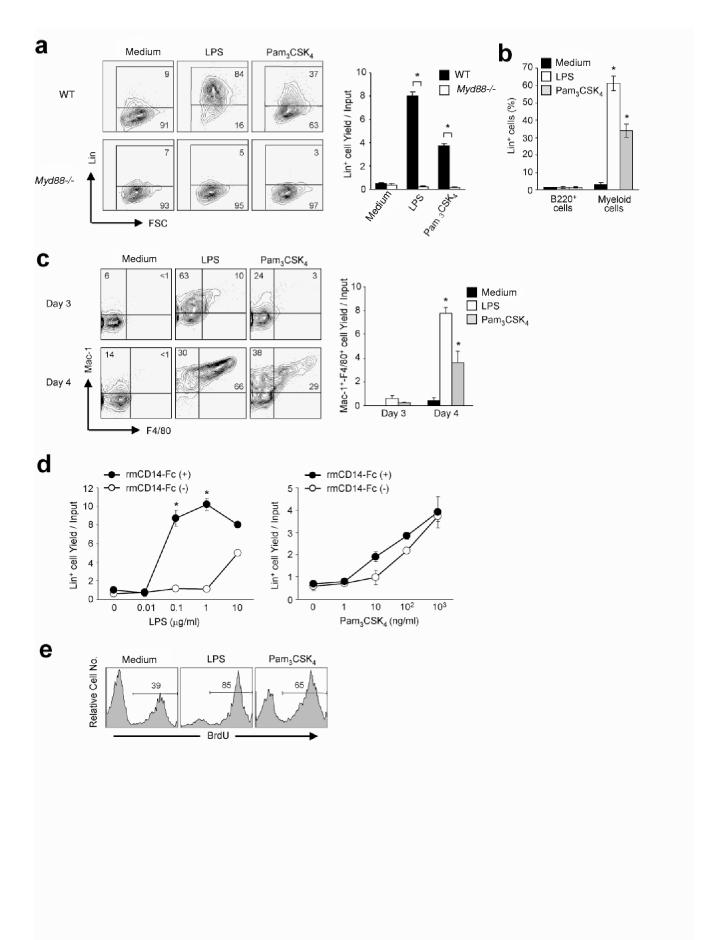
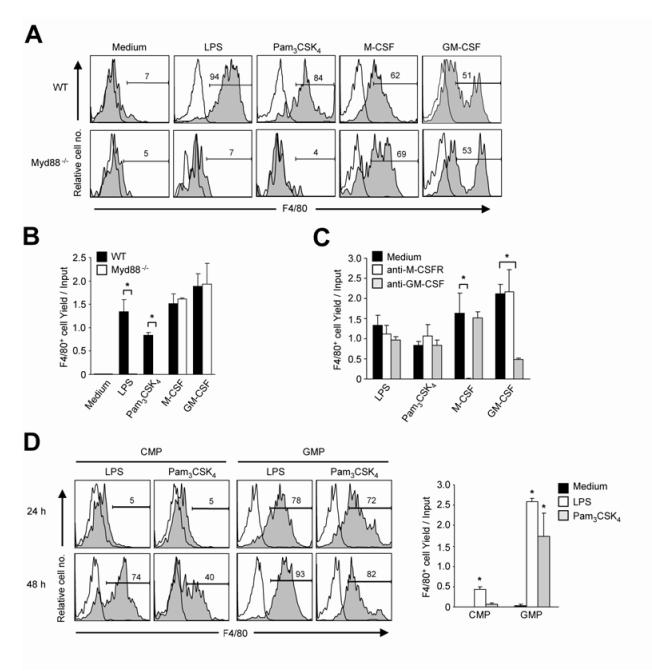
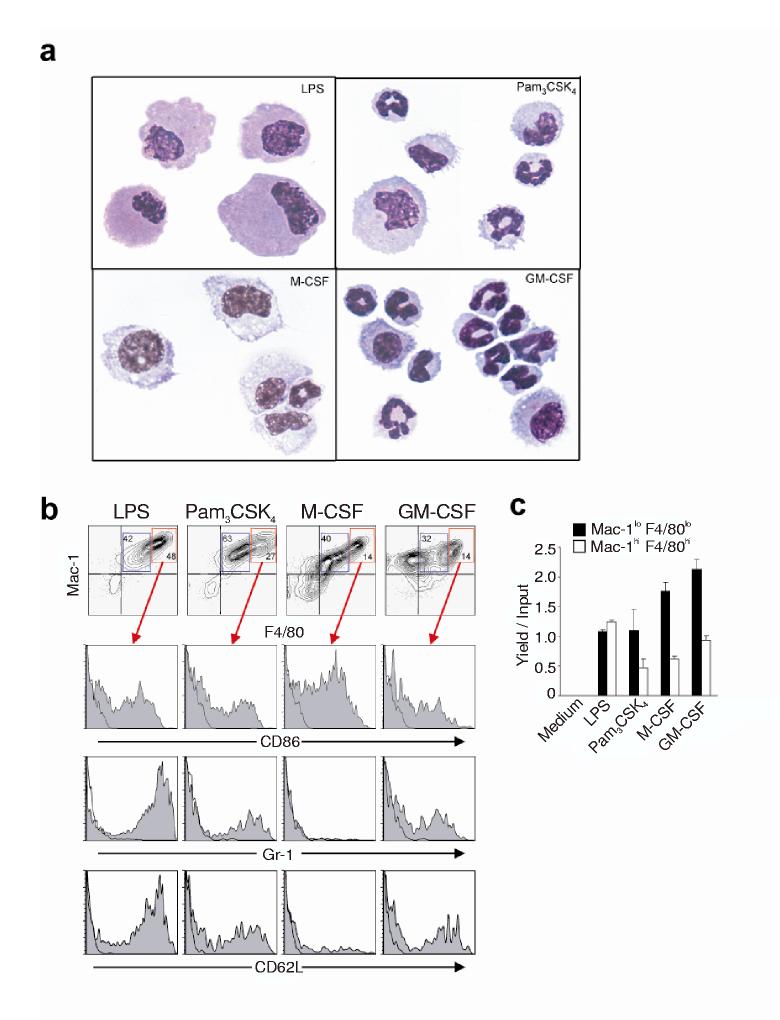
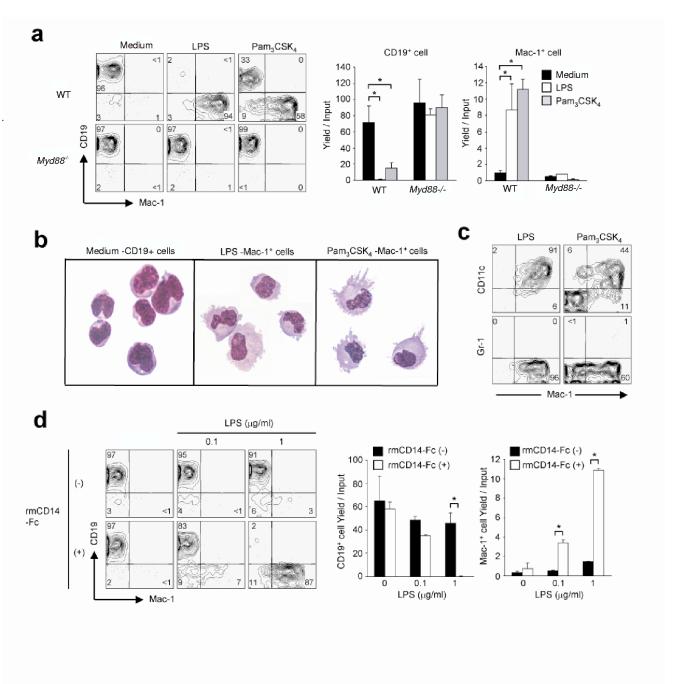
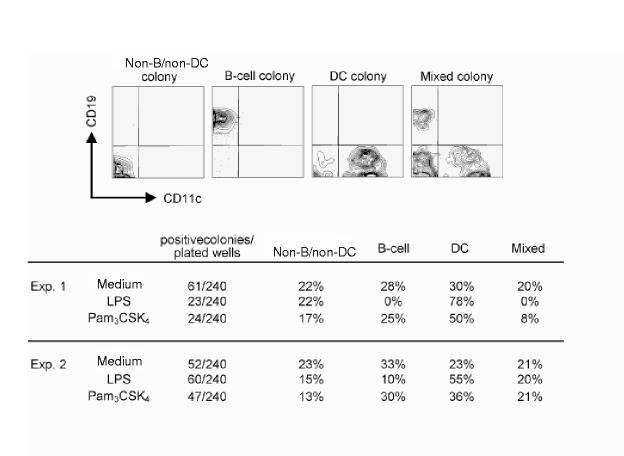
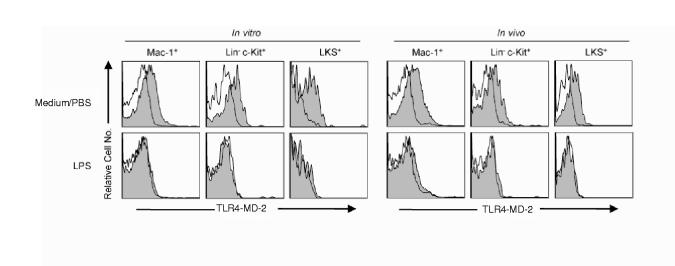
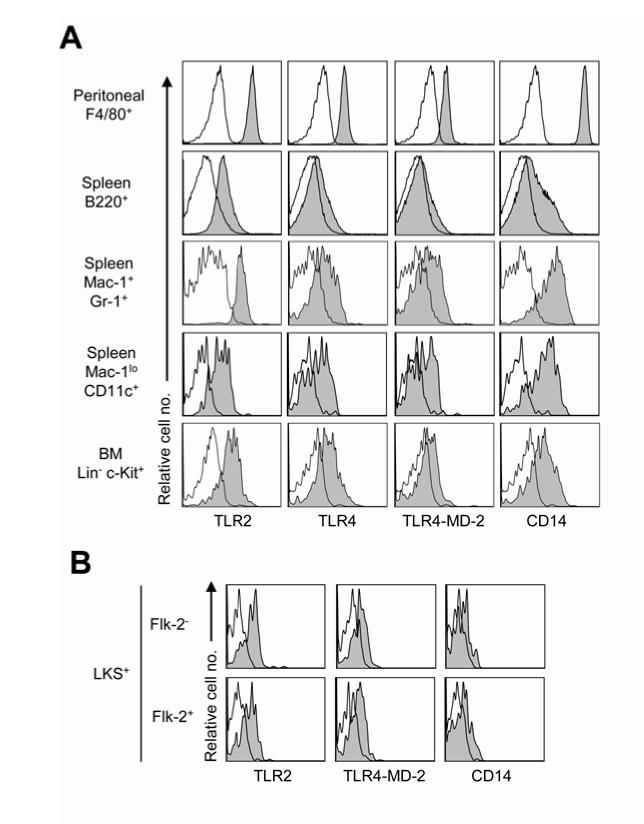
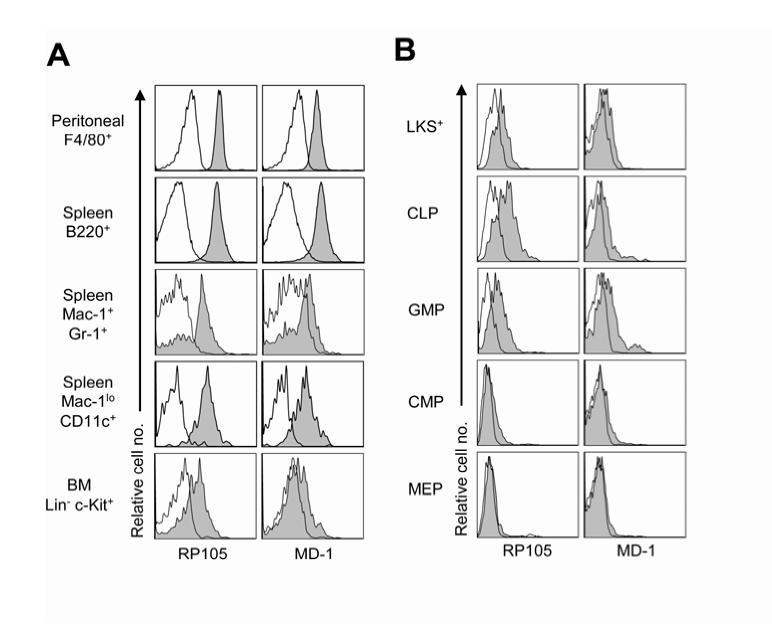
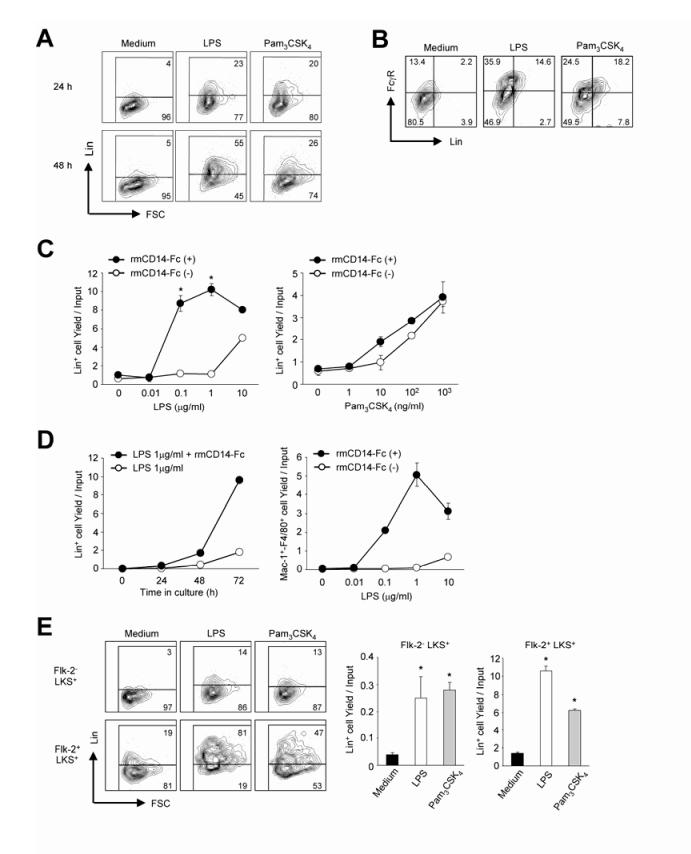
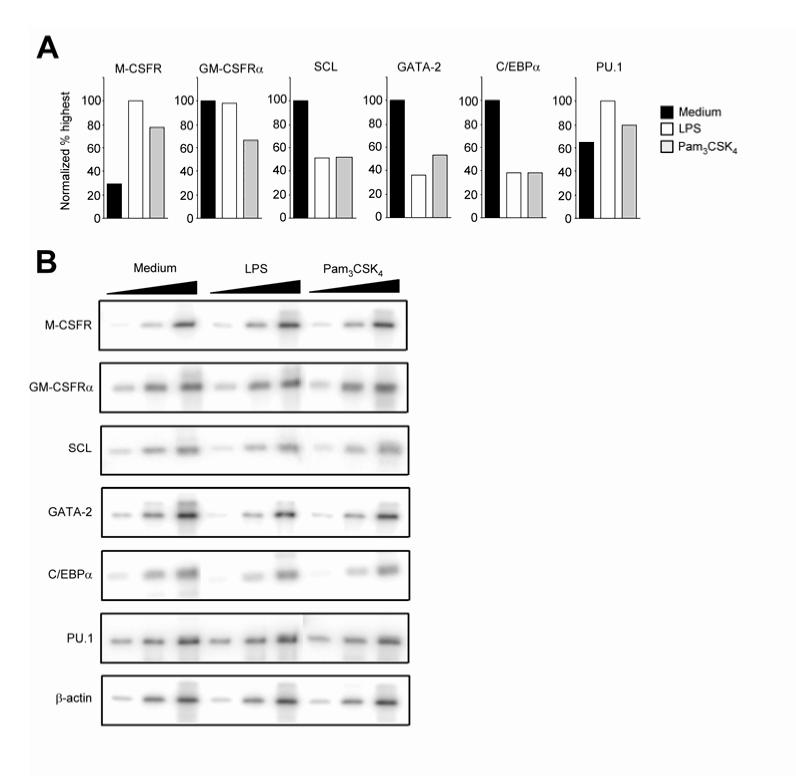
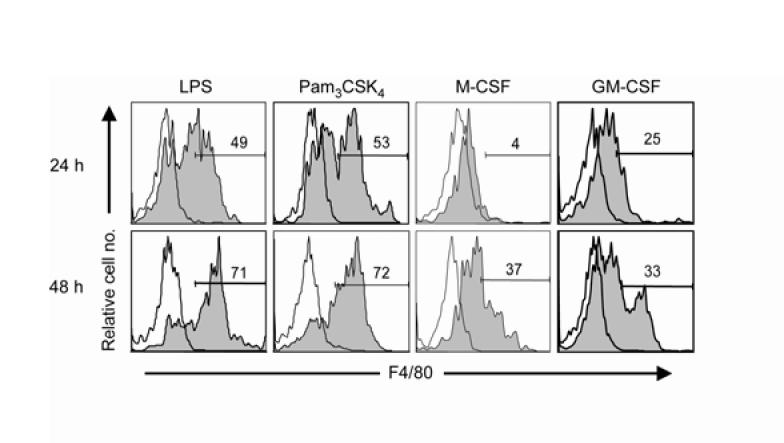
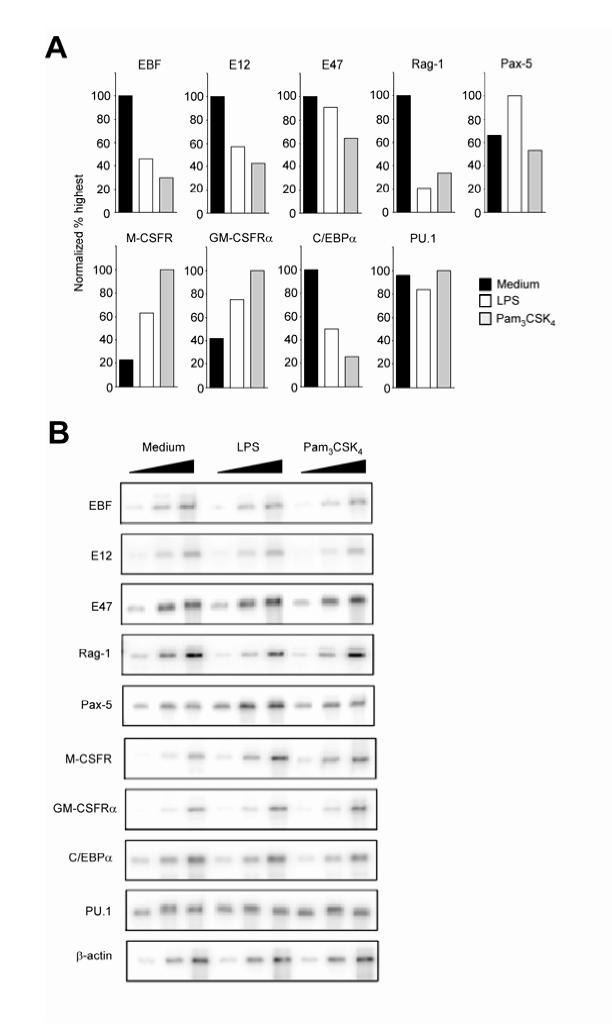
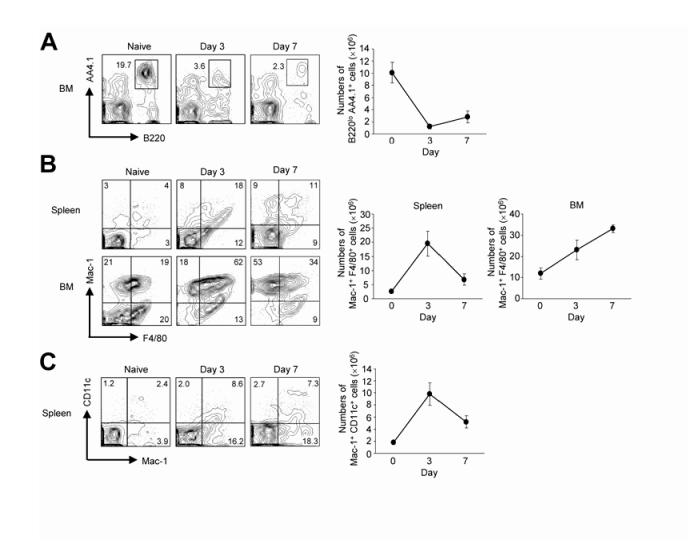
Toll-like receptors (TLRs) are best known for their ability to recognize microbial or viral components and initiate innate immune responses. We showed here that TLRs and their coreceptors were expressed by multipotential hematopoietic stem cells, whose cell cycle entry was triggered by TLR ligation. TLR expression also extended to some of the early hematopoietic progenitors, although not the progenitor cells dedicated to megakaryocyte and erythroid differentiation. TLR signaling via the Myd88 adaptor protein drove differentiation of myeloid progenitors, bypassing some normal growth and differentiation requirements, and also drove lymphoid progenitors to become dendritic cells. CD14 contributed to the efficiency of lipopolysaccharide (LPS) recognition by stem and progenitor cells, and LPS interacted directly with the TLR4/MD-2 complex on these cells in bone marrow. Thus, the preferential pathogen-mediated stimulation of myeloid differentiation pathways may provide a means for rapid replenishment of the innate immune system during infection.


Figures

Figure 1
Figure 1
TLRs and related molecules are expressed by hematopoietic stem cells and progenitor cells.(A) Lineage marker negative cells were enriched from bone marrow suspensions before staining with antibodies to hematopoietic subsets and TLR2, TLR4, TLR4-MD-2, or CD14. Open histograms depict staining with the appropriate isotype matched Abs. The results shown are representative of three independent experiments. (B) Total RNA was extracted from each progenitor subset and semi-quantitative RT-PCR was conducted to detect mRNA encoding TLR4, MD-2, TLR2, and CD14. The results are shown as values normalized to peak expression for each of the transcripts and representative of two independent experiments.
Figure 2
Figure 2
Activation of TLRs through Myd88 on LKS+ cells leads to myeloid cell differentiation and stem cell rich Flk-2- cells enter the cell cycle with TLR ligation.(A) Left, sorted LKS+ cells (10,000 cells/well) from C57BL/6 or Myd88-/- mice were cultured in the presence of FL and SCF with medium alone, LPS (10 μg/ml) or Pam3CSK4 (1 μg/ml). After 72 hr in culture, cells were analyzed by flow cytometry for expression of lineage markers. Percentages indicate the frequencies of Lin+ or Lin- cells. Right, the bar graph depicts yields, i.e., numbers of Lin+ cell recovered per input progenitor and the data represent mean values with standard deviations from triplicate cultures (*P<0.01). The results are representative of five independent experiments. Similar results were obtained when 1,600, 5,000, or 7,500 LKS+ cells were plated per well (data not shown). (B) Expression of CD45R/B220 or myeloid cell markers (Mac-1 and/or Gr-1) on cultured cells. The bar graph depicts percentages of recovered cells bearing B220, CD11b/Mac-1 and/or Gr-1 lineage markers. Data represent mean values with standard deviations from triplicate cultures (*P<0.001). Similar results were obtained in three independent experiments. (C) Left, sorted LKS+ cells (10,000 cells/well) from C57BL/6 mice were cultured in the presence of FL and SCF with medium alone, LPS (10 μg/ml) or Pam3CSK4 (1 μg/ml). After 72 or 96 hr in culture, cells were analyzed by flow cytometry for Mac-1 and F4/80. Right, the bar graph depicts cell yields. Data represent mean values with standard deviations from triplicate cultures and are representative of three independent experiments (*P<0.002). (D) Sorted Flk-2- LKS+ (10,000 cells/well) were cultured in the presence of SCF with medium alone, LPS (10 μg/ml) or Pam3CSK4 (1 μg/ml) for 50 hr, pulsing with 10 μM BrdU for the final 18 hr. Cells were then stained with anti-BrdU. Percentages indicate the frequencies of BrdU+ cells and the results are representative of three independent experiments.
Figure 3
Figure 3
Activation of TLRs through Myd88 bypasses normal differentiation cues and drives monocyte and/or macrophage differentiation of myeloid progenitors.(A) Sorted LKS- cells from C57BL/6 or Myd88-/- mice were stimulated with medium alone, LPS (10 μg/ml), Pam3CSK4 (1 μg/ml), M-CSF, or GM-CSF. After 72 hr in culture, cells were analyzed by flow cytometry for expression of F4/80. Open histograms depict staining with the isotype matched Ab for F4/80. Percentages given in each histogram indicate the frequencies of F4/80+ cells and the results are representative of three independent experiments. (B) The bar graph depicts yields, i.e., numbers of F4/80+ cell recovered per input progenitor. Data represent mean values with standard deviations from triplicate cultures and the results are representative of three independent experiments (*P<0.005). (C) Sorted LKS- cells from C57BL/6 mice were stimulated with LPS (10 μg/ml), Pam3CSK4 (1 μg/ml), M-CSF, or GM-CSF in the presence of anti-M-CSFR (10 μg/ml) or anti-GM-CSF (10 μg/ml). After 72 hr in culture, cells were analyzed by flow cytometry for expression of F4/80. Data represent mean values with standard deviations from triplicate cultures and the results are representative of three independent experiments (*P<0.01). (D) Left, sorted CMPs or GMPs from C57BL/6 mice were stimulated with LPS (10 μg/ml) or Pam3CSK4 (1 μg/ml). After 24 or 48 hr in culture, cells were analyzed by flow cytometry for expression of F4/80. Open histograms depict staining with the isotype matched Abs for F4/80. Frequencies of F4/80+ cells are given in each histogram and the bar graphs on the right depict cell yields. The data represent mean values with standard deviations from triplicate cultures and are representative of three independent experiments (*P<0.02).
Figure 4
Figure 4
TLR stimulation drives differentiation of GMPs into F4/80hi monocytes and/or macrophages.(A) These photomicrographs were prepared with Giemsa-May-Grünwald stained cytocentrifuged slides. (B, C) Sorted GMPs were stimulated with LPS (1 μg/ml), Pam3CSK4 (100 ng/ml), M-CSF, or GM-CSF. After 72 hr in culture, cells were analyzed by flow cytometry for expression of F4/80 and Mac-1. Percentages indicate the frequencies of Mac-1lo F4/80lo or Mac-1hi F4/80hi cells. CD86, Gr-1, or CD62L were analyzed by flow cytometry on Mac-1hi F4/80hi cells. Open histograms depict staining with the appropriate isotype matched Abs. The results are representative of those obtained in two independent experiments. (C) The bar graphs depict cell yields of Mac-1lo F4/80lo or Mac-1hi F4/80hi cells. The data represent mean values with standard deviations from triplicate cultures and are representative of three independent experiments.
Figure 5
Figure 5
TLR stimulation allows lymphoid biased progenitors to produce dendritic cells at the expense of B lymphopoiesis.(A) Sorted CLPs (5,000/well) from C57BL/6 or Myd88-/- mice were stimulated in X-VIVO15 medium alone, LPS (10 μg/ml) or Pam3CSK4 (100 ng/ml) plus SCF, FL and IL-7. After 7 days in culture, cells were analyzed by flow cytometry for expression of CD19 and Mac-1 (Left). The bar graphs depict cell yields for CD19+ cells or Mac-1+ cells (Right) and the data represent mean values with standard deviations from triplicate cultures (*P<0.02). The results are representative of those obtained in five independent experiments. (B) Subsets of the recovered cells described in panel (A) were sorted and used to prepare Giemsa-May-Grünwal stained slides. (C) Cultured cells from C57BL/6 mice were also analyzed by flow cytometry for expression of Gr-1 and CD11c. (D) Sorted CLPs from C57BL/6 mice were cultured in the presence of SCF, FL and IL-7 with a range of concentrations of LPS or combinations of recombinant mouse CD14-Fc protein (1 μg/ml) plus LPS. After 7 days in culture, cells were analyzed by flow cytometry for expression of CD19 and Mac-1 (Left). The bar graph depicts cell yields for CD19+ cells or Mac-1+ cells (Right). Data represent mean values with standard deviations from triplicate cultures (*P<0.003). The results are representative of three independent experiments.
Figure 6
Figure 6
Altered differentiation patterns of single lymphoid progenitors activated via TLRs.Sorted CLPs were cultured in the presence of SCF, FL and IL-7 with medium alone, LPS (10 μg/ml) or Pam3CSK4 (1 μg/ml). After 24 hr, cultured cells were harvested and washed three times with medium. Single cultured cells were then sorted and re-cultured on OP9 stromal cells in 96-well plates for 10 days in the presence of SCF, FL and IL-7. Positive colonies were examined by flow cytometry (representative examples shown on top row). The frequencies of wells with each of these differentiation patterns are shown along with total numbers of clones observed.
Figure 7
Figure 7
LPS rapidly changes the TLR4-MD-2 complex on hematopoietic stem/progenitors.Left, whole bone marrow cells from C57BL/6 mice were cultured with medium alone or LPS (1 μg/ml) for 1 hr. The cells were then harvested and stained with mAbs to TLR4-MD-2, Mac-1, lineage markers as described in Methods, Sca-1, and c-Kit. The MTS 10 reagent is unique in detecting a conformation dependent epitope on TLR4-MD-2 (Akashi et al., 2003). Open histograms depict staining with the isotype matched Ab for TLR4-MD-2. The results are representative of three independent experiments. Right, C57BL/6 mice were intravenously or intraperitoneally injected with PBS or 100 μg LPS from E. coli. After 1 hr, mice were sacrificed, and whole bone marrow cells were harvested and stained with mAbs to TLR4-MD-2, Mac-1, lineage markers, Sca-1, and c-Kit. Open histograms depict staining with the isotype matched Ab for TLR4-MD-2. The results are representative of four independent experiments.
Supplementary Figure 1
Lin- c-Kit+ progenitors in bone marrow express TLRs and their co-receptors.(A) TLR2, TLR4, TLR4-MD-2, or CD14 were analyzed by flow cytometry on mature peripheral cells or Lin- c-Kit+ bone marrow cells. Peritoneal lavage cells from C57BL/6 mice were stained with mAbs to F4/80 together with TLR2, TLR4, TLR4-MD-2, or CD14. Whole spleen cells from C57BL/6 mice were stained with mAbs to B220, Mac-1, Gr-1, and CD11c together with TLR2, TLR4, TLR4-MD-2, or CD14. Whole bone marrow cells from C57BL/6 mice were stained with mAbs to lineage markers as described in Methods and c-Kit together with TLR2, TLR4, TLR4-MD-2, or CD14. Open histograms depict staining with the isotype matched Abs. The results shown are representative of three independent experiments. (B) Whole bone marrow cells from C57BL/6 mice were stained with mAbs to lineage markers, Sca-1, c-Kit, and Flk-2 together with TLR2, TLR4-MD-2, or CD14. Open histograms depict staining with the isotype matched Abs. The results shown are representative of two independent experiments.
Supplementary Figure 2
Lin- stem/progenitor cells express the RP105-MD-1 complex.(A) RP105 or MD-1 were analyzed by flow cytometry on mature peripheral cells or Lin- c-Kit+ bone marrow cells. Peritoneal lavage cells from C57BL/6 mice were stained with mAbs to F4/80 together with RP105 or MD-1. Whole spleen cells from C57BL/6 mice were stained with mAbs to B220, Mac-1, Gr-1, and CD11c together with RP105 or MD-1. Whole bone marrow cells from C57BL/6 mice were stained with mAbs to lineage markers as described in Methods, and c-Kit was used together with RP105 or MD-1. Open histograms depict staining with the isotype matched Abs. The results shown are representative of three independent experiments. (B) The RP105-MD-1 complex is expressed by hematopoietic progenitor cells. Open histograms depict staining with the isotype matched Abs and the results are representative of two independent experiments.
Supplementary Figure 3
TLR stimulation causes a progression of Lin+ cells from LKS+ cells and soluble CD14 augments the acquisition of Mac-1 and F4/80.(A) Sorted LKS+ cells (10,000 cells/well) from C57BL/6 mice were cultured in the presence of FL and SCF with medium alone, LPS (10 μg/ml) or Pam3CSK4 (1 μg/ml). After 24 or 48 hr in culture, cells were analyzed by flow cytometry for expression of lineage markers and percentages of Lin+ or Lin- cells are indicated. (B) Sorted LKS+ cells (10,000 cells/well) from C57BL/6 mice were cultured in the presence of FL and SCF with medium alone, LPS (10 μg/ml) or Pam3CSK4 (1 μg/ml). After 24 hr in culture, cells were analyzed by flow cytometry for expression of lineage markers and FcγR. (C) Sorted LKS+ cells from C57BL/6 mice were cultured in the presence of FL and SCF with a range of concentrations of LPS (Left, open circles), Pam3CSK4 (Right, open circles) or a combination of mouse CD14-Fc protein (1 μg/ml) plus LPS (Left, filled circles) or Pam3CSK4 (Right, filled circles). After 72 hr in culture, cells were analyzed by flow cytometry for expression of lineage markers. Data represent mean values with standard deviations from triplicate cultures (*P<0.001). The results are representative of three independent experiments. (D) Left, sorted LKS+ cells from C57BL/6 mice were cultured in the presence of FL and SCF with 1 μg/ml LPS (Left, open circles) or a combination of recombinant mouse CD14-Fc protein (1 μg/ml) plus LPS (Left, filled circles). After 24, 48, or 72 hr in culture, cells were analyzed by flow cytometry for expression of lineage markers. The graph depicts cell yields and the results are representative of two independent experiments. Right, sorted LKS+ cells from C57BL/6 mice were cultured in the presence of FL and SCF with a range of concentrations of LPS (Right, open circles) or a combination of recombinant mouse CD14-Fc protein (1 μg/ml) plus LPS (Right, filled circles). After 72 hr in culture, cells were analyzed by flow cytometry for expression of Mac-1 and F4/80. The graph depicts cell yields and the data are representative of two independent experiments. (E) Sorted Flk-2- or Flk-2+ LKS+ cells (10,000 cells/well) were cultured with medium alone, LPS (10 μg/ml) or Pam3CSK (1 μg/ml). Flk-2- LKS+ cells were cultured with SCF. Flk-2 LKS+ cells were cultured with SCF and FL. After 72 h in culture, cells were analyzed by flow cytometry for expression of lineage markers (left panels). Percentages given in quadrants indicate the frequencies of Lin+ or Lin- cells and the bar graphs on the right depict cell yields. The data represent mean values with standard deviations from triplicate cultures and the results are representative of three independent experiments. (*P<0.03: Flk-2- LKS+, *P<0.002: Flk-2+ LKS+)
Supplementary Figure 4
TLR stimulation alters some lineage-associated gene patterns in Flk-2- HSCs.Sorted Flk-2- LKS+ cells from C57BL/6 mice were stimulated with medium alone, LPS (10 μg/ml) or Pam3CSK4 (1 μg/ml) in the presence of SCF. After 24 hr in culture, cells were harvested and mRNAs were isolated from cultured cells. Semi-quantitative RT-PCR was carried out to amplify transcripts for the indicated genes in each population. (A) The results are shown as values normalized to peak expression for each of the transcripts and actual bands are shown in (B).
Supplementary Figure 5
TLR stimulation causes rapid production of F4/80+ cells from LKS- cells.Sorted LKS- cells (10,000 cells/well) from C57BL/6 mice were cultured with LPS (10 μg/ml), Pam3CSK4 (1 μg/ml), M-CSF, or GM-CSF. Virtually no viable cells were recovered from wells with no stimulus and were not studied further. Stimulated wells were analyzed after 24 or 48 hr of culture by flow cytometry for expression of F4/80. Open histograms depict staining with the isotype matched Ab for F4/80. Percentages of F4/80+ cells are representative of three independent experiments.
Supplementary Figure 6
Alteration of some lineage-associated gene patterns in TLR ligated CLPs.Sorted CLPs from C57BL/6 mice were stimulated with medium alone, LPS (10 μg/ml) or Pam3CSK4 (1 μg/ml) in the presence of IL-7, FL, and SCF. After 24 hr in culture, cells were harvested and mRNAs were isolated from cultured cells. Semi-quantitative RT-PCR was carried out to amplify transcripts for the indicated genes in each population. (A) The results are shown as values normalized to peak expression for each of the transcripts and actual bands are shown in (B).
Supplementary Figure 7
Dramatic alterations in B lineage cells, monocytes and/or macrophages and dendritic cells in LPS treated mice.C57BL/6 mice were injected intraperitoneally with 100 μg LPS from E. coli. After 3 or 7 days, bone marrow cells from femurs and tibiae or spleen cells were stained with mAbs to the indicated markers and analyzed by flow cytometry. Percentages of B220lo AA4.1+ (A), Mac-1+ F4/80+ (B), or Mac-1+ CD11c+ (C) cells are indicated. The graphs depict cell numbers of B220lo AA4.1+ (A), Mac-1+ F4/80+ (B), or Mac-1+ CD11c+ (C) cells. Data represent mean values with standard deviations from four mice and are representative of two independent experiments.
Supplementary Method 1
Supplementary Method 2

Comment in

References

    1. Akashi K, Traver D, Miyamoto M, Weissman IL. A clonogenic common myeloid progenitor that gives rise to all myeloid lineages. Nature. 2000;404:193–197. - PubMed
    1. Akashi S, Saitoh S, Wakabayashi Y, Kikuchi T, Takamura N, Nagai Y, Kusumoto Y, Fukase K, Kusumoto S, Adachi Y, Kosugi A, Miyake K. Lipopolysaccharide interaction with cell surface Toll-like receptor 4-MD-2: higher affinity than that with MD-2 or CD14. J. Exp. Med. 2003;198:1035–1042. - PMC - PubMed
    1. Beutler B, Rietschel ET. Innate immune sensing and its roots: the story of endotoxin. Nat. Rev. Immunol. 2003;3:169–176. - PubMed
    1. Blander JM, Medzhitov R. Regulation of phagosome maturation by signals from toll-like receptors. Science. 2004;304:1014–1018. - PubMed
    1. Christensen JL, Weissman IL. Flk-2 is a marker in hematopoietic stem cell differentiation: a simple method to isolate long-term stem cells. Proc. Natl. Acad. Sci. U.S.A. 2001;98:14541–14546. - PMC - PubMed

Publication types

MeSH terms