. 2006 Sep 15;91(6):2206-15.
doi: 10.1529/biophysj.105.078089. Epub 2006 Jun 16.

Transient loss of voltage control of Ca2+ release in the presence of maurocalcine in skeletal muscle

Affiliations

Transient loss of voltage control of Ca2+ release in the presence of maurocalcine in skeletal muscle

Sandrine Pouvreau et al. Biophys J. .

Abstract

In skeletal muscle, sarcoplasmic reticulum (SR) calcium release is controlled by the plasma membrane voltage through interactions between the voltage-sensing dihydropyridine receptor (DHPr) and the ryanodine receptor (RYr) calcium release channel. Maurocalcine (MCa), a scorpion toxin peptide presenting some homology with a segment of a cytoplasmic loop of the DHPr, has been previously shown to strongly affect the activity of the isolated RYr. We injected MCa into mouse skeletal muscle fibers and measured intracellular calcium under voltage-clamp conditions. Voltage-activated calcium transients exhibited similar properties in control and in MCa-injected fibers during the depolarizing pulses, and the voltage dependence of calcium release was similar under the two conditions. However, MCa was responsible for a pronounced sustained phase of Ca(2+) elevation that proceeded for seconds following membrane repolarization, with no concurrent alteration of the membrane current. The magnitude of the underlying uncontrolled extra phase of Ca(2+) release correlated well with the peak calcium release during the pulse. Results suggest that MCa binds to RYr that open on membrane depolarization and that this interaction specifically alters the process of repolarization-induced closure of the channels.


Figures

FIGURE 1
FIGURE 1
Incomplete decay of step depolarization-activated Ca2+ transients in MCa-injected fibers. (A) Indo-1 saturation transients elicited by consecutive depolarizing steps of 10, 30, and 50 ms duration to +10 mV in a control fiber (top) in an MCa-injected fiber (middle), and in a fiber injected with the mutated analog [Ala24]MCa. (B) Mean values for the baseline [Ca2+] level in control (n = 5), MCa-injected (n = 9), and [Ala24]MCa-injected fibers (n = 5) challenged by a 10- and a 30-ms-long pulse to +10 mV. (C and D) Corresponding values for the peak Δ[Ca2+] and the Δ[Ca2+] measured ∼1 s after the onset of the pulse, respectively. (E) Corresponding mean values for the ratio of the Δ[Ca2+] measured ∼1 s after the onset of the pulse (mean shown in C) to the peak Δ[Ca2+] during the pulse (mean shown in D). See text for details.
FIGURE 2
FIGURE 2
The long-lasting [Ca2+] elevation following the end of a step depolarization in MCa-injected fibers. Traces correspond to indo-1 saturation records of 15 s duration in a control fiber and in two MCa-injected fibers depolarized by short pulses to +10 mV of various durations. Pulses of 5 and 10 ms duration were applied in the control fiber (left). Pulses of 5, 10, and 30 ms duration were applied in the two MCa-injected fibers.
FIGURE 3
FIGURE 3
The MCa-induced long-lasting postpulse [Ca2+] elevation is not associated with a change in the holding membrane current. In A and B, the top series of traces correspond to successive (from left to right) indo-1 saturation transients elicited by a 5-ms-long pulse to +10 mV in a control fiber (A) and in an MCa-injected fiber (B); the bottom series of traces show the corresponding membrane current records at a high gain.
FIGURE 4
FIGURE 4
The MCa-induced long-lasting postpulse [Ca2+] elevation persists in the absence of extracellular calcium. All records are from the same fiber injected with MCa. The top series of traces corresponds to the changes in membrane current elicited by a 20-ms-long pulse to +10 mV. The indo-1 calcium signals measured simultaneously are shown underneath on a more compressed timescale. Records were taken in the presence of the control extracellular solution (left), in the absence of extracellular calcium (middle), and after returning to the calcium-containing control solution (right). Membrane current records were corrected for the linear components.
FIGURE 5
FIGURE 5
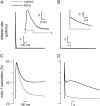
Simulation of the effect of MCa using a simple model of intracellular Ca2+ distribution. (A and B) Synthetic Ca2+ release flux traces in control conditions (thin trace) and in the presence of MCa (thick trace). In A and B the same traces are shown on a short and long timescale, respectively. In A, the inset focuses on the peak phase of the release traces. In B, the inset shows the two traces on an expanded y scale. The only difference between the control and the MCa trace is the presence of a small slowly decaying extra phase of Ca2+ release in the presence of MCa. This extra phase is best seen in the inset of panel B. (C and D) Corresponding calculated indo-1 saturation traces on short and long timescales, respectively.
FIGURE 6
FIGURE 6
Voltage dependence of Ca2+ release in control fibers and in MCa-injected fibers. (A) Indo-1 saturation transients measured in response to the pulse protocol illustrated on top, in a control fiber (left) and in an MCa-injected fiber (right). The protocol consisted of a sequence of three consecutive step depolarizations of 30 ms duration. During the first sequence the three successive steps were to −50, −30, and −10 mV, respectively. The amplitude of each of the three steps was then incremented by 5 mV, and the sequence was repeated. The sequence was applied five times so that during the last run the three steps were to −30, −10, and +10 mV, respectively. Indo-1 transients obtained in response to the five sequences are shown superimposed. (B) Ca2+ release flux calculated from the above indo-1 transients; only the release flux from the indo-1 trace obtained in response to the successive pulses to −30, −10, and +10 mV is shown. The y scale bar in each panel corresponds to 1 μM/ms. The horizontal dotted line corresponds to the initial baseline level. Solid and open arrows point to the peak and postpulse release flux levels that were measured, respectively; amplitudes were measured from the prepulse level. The postpulse flux values were taken as the average from a 100-ms-long portion of trace 500 ms following the pulse onset. The mean from these measurements is reported in the following panels. (C) Mean voltage dependence of the peak Ca2+ release flux in control fibers (solid circles, n = 3) and in MCa-injected fibers (open circles, n = 4). (D) Corresponding mean voltage dependence of the postpulse Ca2+ release flux. (E) Plot of the individual values of the postpulse release flux versus the corresponding peak release flux in the control (solid symbols) and the MCa-injected fibers (open symbols). Different symbols correspond to the different fibers.
FIGURE 7
FIGURE 7
Voltage-activated Ca2+ transients in fibers injected with a synthetic peptide corresponding to domain A of the II–III loop of the DHPr α1 subunit. (A) Indo-1 saturation transients elicited by consecutive depolarizing steps of 10, 20, and 50 ms duration to +10 mV in a control fiber (top) and in a peptide A-injected fiber (bottom). (B) Mean values for the baseline [Ca2+] level in control (n = 4) and peptide A-injected fibers (n = 4) challenged by the pulse protocol shown in A. (C and D) Corresponding values for the peak Δ[Ca2+] and the Δ[Ca2+] measured ∼1 s after the onset of the pulse, respectively. (E) Corresponding mean values for the ratio of the Δ[Ca2+] measured ∼1 s after the onset of the pulse (mean shown in C) to the peak Δ[Ca2+] during the pulse (mean shown in D).

Similar articles

Cited by

References

    1. Tanabe, T., K. G. Beam, B. A. Adams, T. Niidome, and S. Numa. 1990. Regions of the skeletal muscle dihydropyridine receptor critical for excitation-contraction coupling. Nature. 346:567–569. - PubMed
    1. Lu, X., L. Xu, and G. Meissner. 1994. Activation of the skeletal muscle calcium release channel by a cytoplasmic loop of the dihydropyridine receptor. J. Biol. Chem. 269:6511–6516. - PubMed
    1. Nakai, J., T. Tanabe, T. Konno, B. Adams, and K. G. Beam. 1998. Localization in the II–III loop of the dihydropyridine receptor of a sequence critical for excitation-contraction coupling. J. Biol. Chem. 273:24983–24986. - PubMed
    1. El-Hayek, R., B. Antoniu, J. Wang, S. L. Hamilton, and N. Ikemoto. 1995. Identification of calcium release-triggering and blocking regions of the II–III loop of the skeletal muscle dihydropyridine receptor. J. Biol. Chem. 270:22116–22118. - PubMed
    1. Dulhunty, A. F., D. R. Laver, E. M. Gallant, M. G. Casarotto, S. M. Pace, and S. Curtis. 1999. Activation and inhibition of skeletal RyR channels by a part of the skeletal DHPR II–III loop: effects of DHPR Ser687 and FKBP12. Biophys. J. 77:189–203. - PMC - PubMed

Publication types