. 2006 Jun 27;103(26):10052-7.
doi: 10.1073/pnas.0603584103. Epub 2006 Jun 16.

Microstimulation of the somatosensory cortex can substitute for vibrissa stimulation during Pavlovian conditioning

Affiliations

Microstimulation of the somatosensory cortex can substitute for vibrissa stimulation during Pavlovian conditioning

Rocio Leal-Campanario et al. Proc Natl Acad Sci U S A. .

Abstract

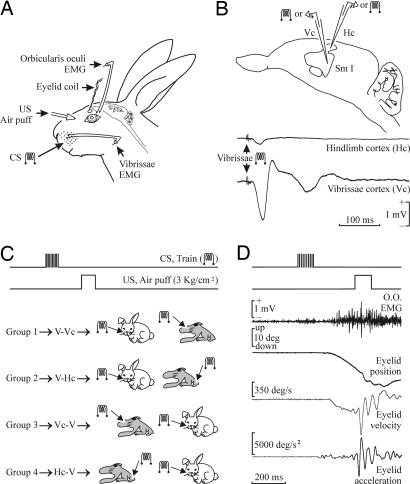
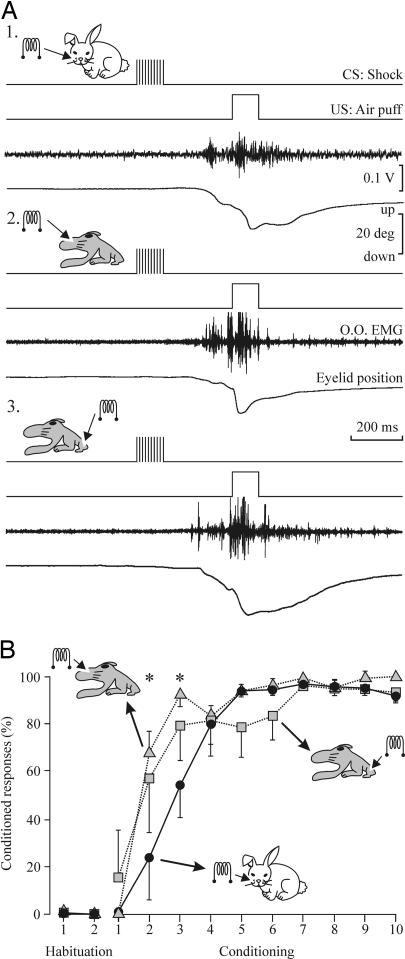
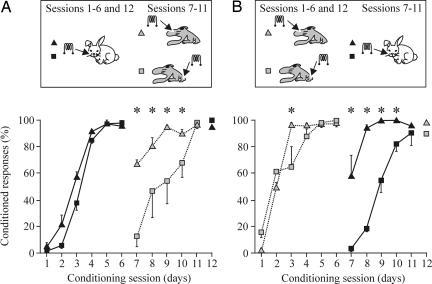
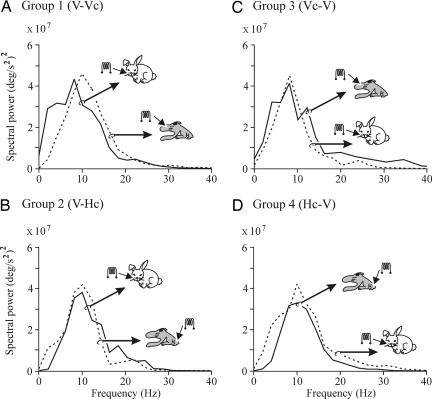
The primary somatosensory cortex (S1) contains a map representation of the body surface. We hypothesized that S1 stimulation can successfully substitute for (or be substituted by) direct stimulation of skin receptors. We prepared rabbits for evoking eyelid conditioned responses (CRs) using a trace "shock-air puff" paradigm. In a first series of experiments, animals received a conditioned stimulus (CS, a train of electrical pulses) in the whisker pad or in the S1 areas for vibrissae or for the hind limb. In the three cases, the CS was followed 250 ms from its end by an air puff presented to the cornea as an unconditioned stimulus (US). Learning curves from the three groups presented similar values, although animals stimulated with a central CS acquired their CRs faster. In a second series of experiments, animals were divided into four groups and were presented either centrally or peripherally with the same CS for six conditioning sessions. Then, the CS was switched from central to peripheral, or vice versa, for 5 additional days. Conditioned animals were not able to discriminate between peripheral (vibrissae) stimuli and stimuli presented to the corresponding S1 (vibrissae) area, but they were able to discriminate between CSs presented to S1 (hind limb) and body (vibrissae) regions. The kinetic properties of evoked CRs were not modified by CS switching. It is proposed that S1 allows the construction of somatosensory percepts of the body surface but does not allow distinguishing the central or peripheral location of the evoking stimuli.


Conflict of interest statement

Conflict of interest statement: No conflicts declared.

Figures

Fig. 1.
Fig. 1.
Experimental design. (A) We recorded the upper eyelid position and EMG activity of the ipsilateral orbicularis oculi (O.O.) and vibrissal (V) muscles. Peripheral stimuli consisted of the electrical stimulation of the whisker pad as a CS or air puffs presented to the ipsilateral cornea as a US. (B) A diagram of the rabbit S1, illustrating the recording and stimulating sites. Representative examples of the field potentials evoked at the vibrissal (Vc) and hind-limb (Hc) S1 sites by a double-pulse stimulus applied to the contralateral vibrissae. (C) Experimental groups. For the four experimental groups included in Figs. 3 and 4, the CS consisted of a 200-Hz, 100-ms, 1.5 × threshold train presented during the first six conditioning sessions to the left whisker pad (middle part of row C) and then (7th to 11th sessions) to the contralateral S1, the corresponding sites for the C-row vibrissae (group 1) or the hind limb (group 2). For groups 3 and 4, the CS was presented in the reverse order, as illustrated. The US always consisted of a 100-ms 3-kg/cm2 air puff presented to the ipsilateral cornea. (D) Example of a CR recorded during the sixth conditioning session (CS, vibrissa stimulation). Profiles corresponding to O.O. EMG (in mV), eyelid position (in degrees), and acceleration (in degrees per s2) are illustrated.
Fig. 2.
Fig. 2.
Learning curves for vibrissal or S1 stimulation (vibrissal or hind-limb areas) as a CS. (A) Representative examples of CRs evoked by the three CSs selected for this study by the sixth conditioning session. (B) Percentage of CRs reaching criterion across the 10 conditioning sessions. The three groups of animals reached asymptotic values (>80% of CRs) by the fourth to sixth sessions. Data represent mean ± SD. Note that the acquisition of the CR is faster with the two types of central CS than for peripheral (vibrissae) CS [∗, P < 0.05, F(22, 44) = 1.823].
Fig. 3.
Fig. 3.
Acquisition of eyelid CRs during peripheral (vibrissae) followed by central (S1 areas for vibrissae or hind limb) CS, or vice versa. (A) Learning curves for groups 1 (black triangles) and 2 (black squares) in which the CS was presented during the first six sessions to the vibrissae and then (sessions 7–11) switched to the S1 area for vibrissae (group 1, gray triangles) or for the hind limb (group 2, gray squares). Data represent mean ± SD. Note that when the two central CSs were substituted by the peripheral CS, the acquisition was significantly faster for the group stimulated at the S1 area for vibrissae [∗, P < 0.001, F(11, 33) = 4.233]. (B) Learning curves for groups 3 (gray triangles) and 4 (gray squares) in which the CS was presented during the first six sessions to the S1 areas for vibrissae (group 3) or for the hind limb (group 4) and then (sessions 7–11) switched to the vibrissae (group 3, black triangles) or for the hind limb (group 4, black squares). Note that when the peripheral CS were substituted by the two central CSs, the acquisition was significantly faster for the group stimulated at the S1 area for vibrissae [∗, P < 0.05, F(11, 33) = 2.913].
Fig. 4.
Fig. 4.
Quantitative analysis of CR evolution through conditioning sessions for the four experimental groups. (A) The experimental design for groups 1 and 2 is illustrated in the Inset at the top. Time histograms for the latency (1, in ms) and peak amplitude (2, in degrees) of CRs during the sessions (–6) in which the CS was presented to the vibrissae (group 1, black triangles; group 2, black squares) followed by the sessions (–11) in which the CS was presented to the S1 area for vibrissae (group 1, gray triangles) or to the hind limb (group 2, gray squares). Data represent mean ± SD. Significant differences in latency [∗, P < 0.01, F(11, 33) = 2.294] and amplitude [∗, P ≤ 0.05, F(11, 33) = 2.310] after the CS switch are indicated. (B) The experimental design for groups 3 and 4 is illustrated at the top. Time histograms for the latency (1, in ms) and peak amplitude (2, in degrees) of CRs during the sessions (–6) in which the CS was presented to the S1 area for vibrissae (group 3, black triangles) or for the hind limb (group 4, black squares) followed by the sessions (–11) in which the CS was presented to the vibrissae (group 3, gray triangles; group 4, gray squares). Significant differences in latency [∗, P < 0.01, F(11, 33) = 2.965] and amplitude [∗, P < 0.01, F(11, 33) = 4.407] after the CS switch are indicated.
Fig. 5.
Fig. 5.
Frequency domain analyses of eyelid CRs evoked by peripheral and central stimuli used as CS. Histograms showing the mean power spectra of acceleration profiles computed from CRs evoked by CS-alone presentations. Each power spectrum was averaged from ≥12 records. Records were collected from the 6th (continuous lines) or 11th (dotted lines) conditioning sessions for the indicated experimental groups. The CS evoking each record is also indicated. No significant differences were detected between each pair of power spectra (P ≥ 0.1, χ2-distributed test; correlation coefficient ≥0.996, P ≤ 0.005, Pearson test). V, vibrissae; Hc and Vc, hind-limb and vibrissa S1 cortices.

References

    1. Lafuente V. de, Romo R. Nat. Neurosci. 2005;8:1698–1703. - PubMed
    1. Romo R., Salinas E. Annu. Rev. Neurosci. 2001;24:107–137. - PubMed
    1. Wilent W. B., Contreras D. Nat. Neurosci. 2005;8:1364–1370. - PubMed
    1. Romo R., Hernández A., Zainos A., Salinas E. Nature. 1998;392:387–390. - PubMed
    1. Salzman C. D., Britten K. H., Newsome W. T. Nature. 1990;346:174–177. - PubMed

Publication types

LinkOut - more resources