. 2006 Jul;26(13):4818-29.
doi: 10.1128/MCB.02360-05.

Defective mitochondrial gene expression results in reactive oxygen species-mediated inhibition of respiration and reduction of yeast life span

Affiliations

Defective mitochondrial gene expression results in reactive oxygen species-mediated inhibition of respiration and reduction of yeast life span

Nicholas D Bonawitz et al. Mol Cell Biol. 2006 Jul.

Abstract

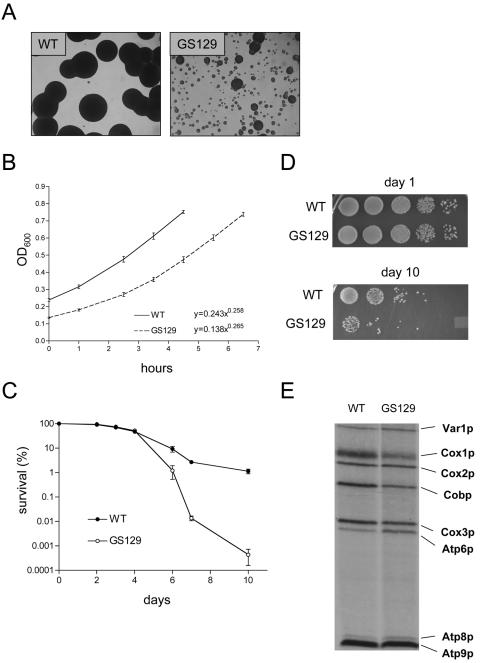
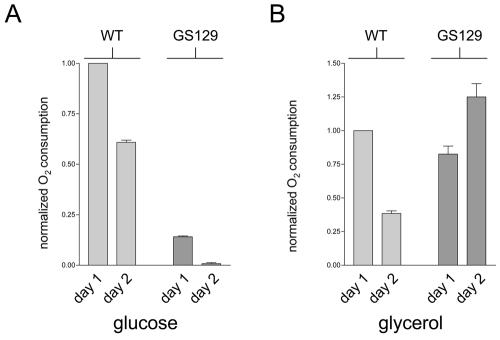
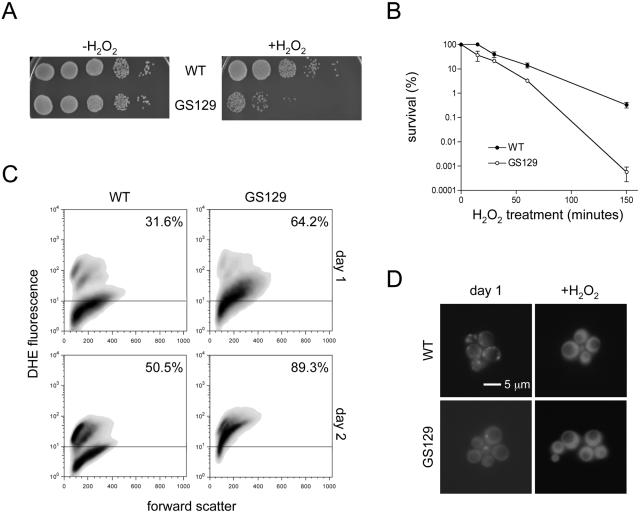
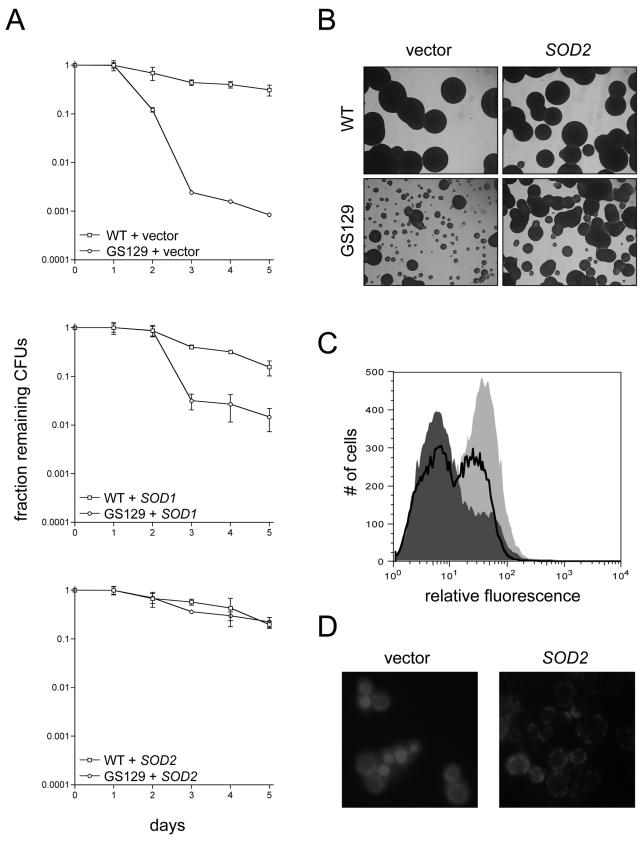
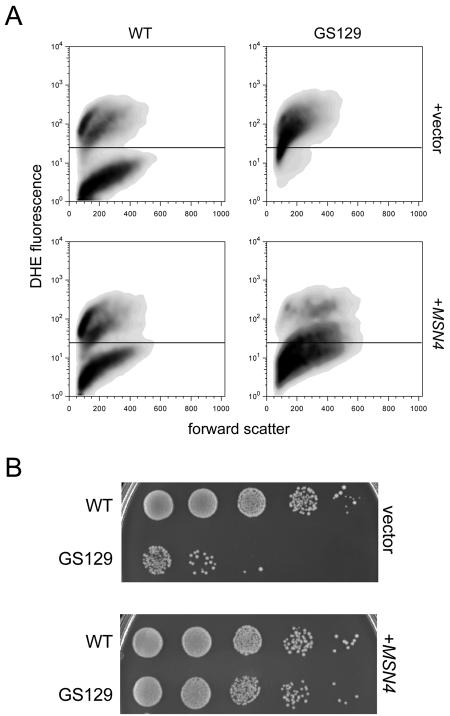
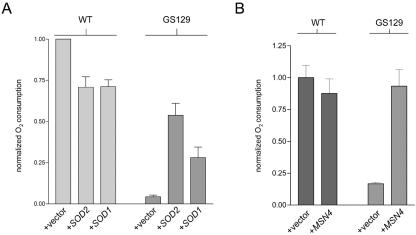
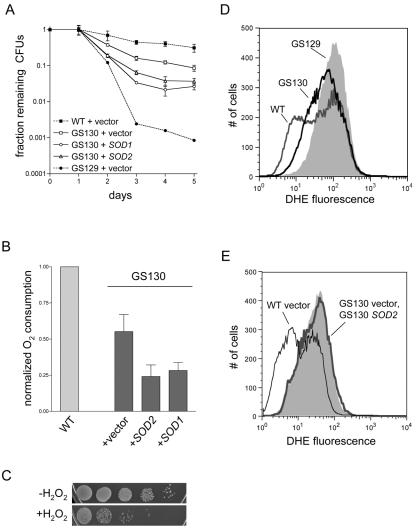
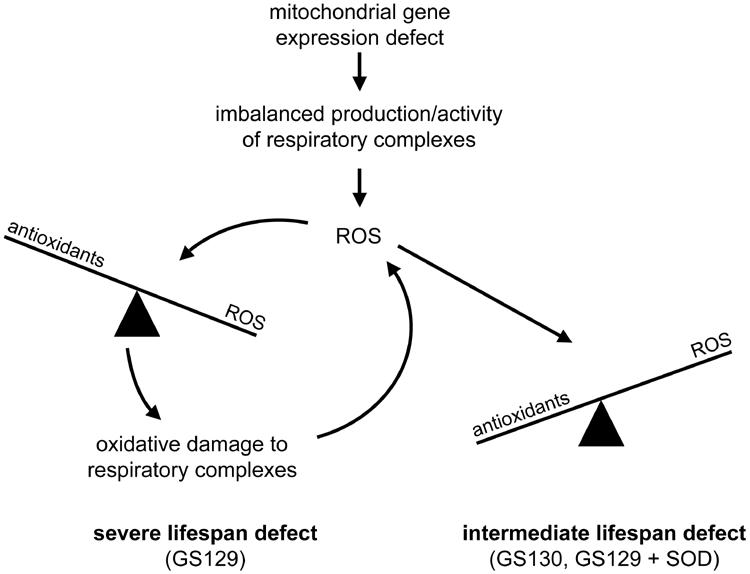
Mitochondrial dysfunction causes numerous human diseases and is widely believed to be involved in aging. However, mechanisms through which compromised mitochondrial gene expression elicits the reported variety of cellular defects remain unclear. The amino-terminal domain (ATD) of yeast mitochondrial RNA polymerase is required to couple transcription to translation during expression of mitochondrial DNA-encoded oxidative phosphorylation subunits. Here we report that several ATD mutants exhibit reduced chronological life span. The most severe of these (harboring the rpo41-R129D mutation) displays imbalanced mitochondrial translation, conditional inactivation of respiration, elevated production of reactive oxygen species (ROS), and increased oxidative stress. Reduction of ROS, via overexpression of superoxide dismutase (SOD1 or SOD2 product), not only greatly extends the life span of this mutant but also increases its ability to respire. Another ATD mutant with similarly reduced respiration (rpo41-D152A/D154A) accumulates only intermediate levels of ROS and has a less severe life span defect that is not rescued by SOD. Altogether, our results provide compelling evidence for the "vicious cycle" of mitochondrial ROS production and lead us to propose that the amount of ROS generated depends on the precise nature of the mitochondrial gene expression defect and initiates a downward spiral of oxidative stress only if a critical threshold is crossed.


Figures

FIG. 1.
FIG. 1.
The mitochondrial RNA polymerase mutant GS129 exhibits a growth defect on the nonfermentable carbon source glycerol and decreased chronological life span. (A) Colonies of wild-type (WT) and rpo41-R129D (GS129) strains after 48 h of growth on glycerol (YPG) agar plates are shown. Samples were spotted from day 1 stationary-phase glucose (SD) cultures (see Materials and Methods). Shown are a 1,000-fold dilution of the wild type and a 100-fold dilution of the GS129 mutant at ×40 magnification. (B) Cultures of the GS129 mutant inoculated from colonies on glucose (SD) agar plates older than ∼30 days exhibited a reproducible lag when grown in liquid glucose (SD) medium. The OD600 of these cultures (y axis) was monitored over time (in hours; x axis) as a measure of growth. The inset equations represent a best-fit line for the curves, where the exponent is inversely proportional to the doubling time. (C) Viability curves of wild-type and GS129 mutant stationary-phase cultures. Viability was determined by trypan blue staining to day 4 and by quantitative plating thereafter (see Materials and Methods). The percentage of survival as a function of days in stationary phase is plotted on a log scale. (D) Relative viability of wild-type and GS129 cultures as determined by plating serial 10-fold dilutions of day 1 and day 10 stationary-phase glucose (SD) cultures onto rich medium (YPD). (E) Mitochondrial translation profiles of wild-type (WT) and GS129 strains. Mitochondrial translation products were specifically labeled by inhibiting cytoplasmic translation, incubating cells with [35S]methionine, and analyzing the products by sodium dodecyl sulfate-polyacrylamide gel electrophoresis and autoradiography. All eight protein products (indicated on the right on the figure) encoded by the Saccharomyces cerevisiae mitochondrial genome are represented.
FIG. 2.
FIG. 2.
GS129 exhibits conditional inactivation of respiration in stationary phase. (A) Oxygen consumption of day 1 and day 2 stationary-phase glucose (SD) cultures of wild type (WT) and GS129. All values were normalized to the OD600 of the culture used, and the mean oxygen consumption/OD600 unit of the wild-type strain was arbitrarily given a value of 1. Each bar represents the average of three independent experiments, with the standard deviations of the three measurements shown. (B) The experiment was the same as that described for panel A but was carried out in glycerol (YPG) medium.
FIG. 3.
FIG. 3.
GS129 displays heightened susceptibility to oxidative stress and aberrant accumulation and localization of ROS. (A) Serial 10-fold dilutions of wild-type (WT) and GS129 day 1 stationary-phase glucose (SD) cultures plated onto rich medium following 150 min of treatment with 25 mM hydrogen peroxide are shown. The left panel shows untreated cultures (−H2O2), and the right panel shows H2O2-treated cultures (+H2O2). (B) Viability curves of the wild type and GS129 following treatment with 25 mM hydrogen peroxide for the time indicated is shown. Percentage survival was determined by plating on rich glucose medium (YPD) and counting colonies and is plotted on a log scale on the y axis. (C) Flow cytometric analysis of endogenous ROS in wild-type (WT) and GS129 cultures stained with 50 μM DHE after 1 day (top panels) or 2 days (bottom panels) in stationary phase. The x axis on each panel is a linear scale of forward scatter (roughly indicative of cell size), and the y axis is a log scale of the intensity of DHE fluorescence. Any fluorescence below 101 is indistinguishable from background and is marked with a horizontal line across each graph. The percentage of cells above this line is indicated in the upper right corner of each panel. (D) Fluorescence-microscopic examination of wild-type (top panels) and GS129 cells (bottom panels) stained with 50 μM DHE at day 1 of stationary phase (left panels) or after treatment with 50 mM H2O2 (right panels).
FIG. 4.
FIG. 4.
Overexpression of SOD1 or SOD2 extends life span in GS129 and rescues ROS levels and localization. (A) Viability curves as determined by quantitative plating of wild-type (WT) or GS129 strains containing empty vector or a plasmid carrying either SOD1 or SOD2. The number of CFU for each strain at day 1 of stationary phase was given a value of 1, and the fraction of CFU remaining (y axis) over time (x axis) is shown. (B) Glycerol (YPG) growth of the vector control and SOD2-overexpressing strains listed in panel A. (C) Flow cytometric measurement of ROS in GS129 with empty vector or overexpressing SOD2 at day 2 of stationary phase. The fluorescent dye DHE was used as described in the legend to Fig. 3. GS129 plus empty vector is shown as the light gray curve, while GS129 overexpressing SOD2 is dark gray. For comparison, the profile of wild-type cells treated identically is overlaid as the boldface black line. (D) Microscopic analysis of GS129 cells containing either empty vector (left panel) or overexpressing SOD2 (right panel) at day 1 of stationary phase stained with 50 μM DHE.
FIG. 5.
FIG. 5.
Overexpression of the stress-responsive transcription factor MSN4 extends life span and decreases ROS in GS129. (A) Flow cytometric analysis of stationary-phase wild type (WT) and GS129 containing either empty vector or a high-copy plasmid containing MSN4. Samples were taken at day 2 of stationary phase and are reported as described in the legend to Fig. 3. (B) Viability (at day 5 of stationary phase) of the strains described for panel A, determined by plating 10-fold serial dilutions onto rich medium (YPD).
FIG. 6.
FIG. 6.
Reducing ROS in the GS129 mutant restores stationary-phase respiration. (A) Oxygen consumption of wild-type (WT) and GS129 cultures containing an empty vector or a plasmid carrying either SOD1 or SOD2 at day 1 of stationary phase. Results are plotted as described in the legend to Fig. 2; all measurements were performed in triplicate and were normalized for differences in OD, with the wild type set to 1. (B) Oxygen consumption of day 2 stationary-phase glucose (SD) cultures of wild-type and GS129 strains containing either an empty vector (+vector) or a plasmid that overexpresses MSN4.
FIG. 7.
FIG. 7.
GS130 exhibits a less severe chronological life span defect than GS129 and is not rescued by overexpression of SOD. (A) Viability of the GS130 mutant plus either empty vector or plasmids that overexpress SOD1 or SOD2, determined as described in the legend to Fig. 4A. The wild-type (WT) and GS129 curves from Fig. 4A (which were carried out in parallel) are shown as dotted lines for comparison. (B) Stationary-phase oxygen consumption of the GS130 strains depicted in panel A. The wild-type result from Fig. 6A is shown for comparison and is given the arbitrary value of 1. (C) Serial 10-fold dilutions of a stationary-phase GS130 culture before (−H2O2) and after (+H2O2) treatment with 25 mM H2O2 for 2.5 h. (D) DHE fluorescence at day 2 of stationary phase of wild type (dark gray line), GS129 (light gray shading), and GS130 (black line). The median and mean fluorescence values, in relative fluorescence units, were the following: wild-type, 44.1 and 78.7; GS130, 59.3 and 89.3; GS129, 99.6 and 125. (E) DHE fluorescence at day 2 of stationary phase of GS130 containing either empty vector (light gray shading) or a plasmid carrying SOD2 (bold gray line), as described in the legend to Fig. 4C. For comparison, the profile of wild-type cells treated identically is overlaid as the thin black line.
FIG. 8.
FIG. 8.
Model depicting how different defects in mitochondrial gene expression differentially affect yeast life span. Depicted is a scenario in which certain types of mitochondrial gene expression defects (e.g., loss of coupling between transcription and translation in this study) result in the imbalanced production/activity of the respiratory chain that initiates increased mitochondrial ROS production (shown at the top of the diagram). Subsequently, the magnitude of the life span reduction depends on the precise nature of the mitochondrial gene expression defect. In the case of the GS130 mutant (rightward branch point), the amount of ROS production is combatted effectively by the normal antioxidant defenses. Nonetheless, the persistent increase in steady-state levels of ROS or decrease in respiration from the underlying mitochondrial gene expression defect causes an intermediate life span decrease. In contrast, in certain circumstances (e.g., GS129 mutant; leftward branch point), the specific manner in which the respiratory chain is disrupted results in enhanced ROS production that damages the OXPHOS complexes and leads to more ROS production (i.e., the vicious cycle of mitochondrial ROS production). Engagement of the vicious cycle overwhelms the antioxidant defenses (irreversibly tipping the balance), leading to a severe life span defect from chronic oxidative stress.

References

    1. Ashrafi, K., D. Sinclair, J. I. Gordon, and L. Guarente. 1999. Passage through stationary phase advances replicative aging in Saccharomyces cerevisiae. Proc. Natl. Acad. Sci. USA 96:9100-9105. - PMC - PubMed
    1. Balaban, R. S., S. Nemoto, and T. Finkel. 2005. Mitochondria, oxidants, and aging. Cell 120:483-495. - PubMed
    1. Bandy, B., and A. J. Davison. 1990. Mitochondrial mutations may increase oxidative stress: implications for carcinogenesis and aging? Free Radic. Biol. Med. 8:523-539. - PubMed
    1. Barros, M. H., B. Bandy, E. B. Tahara, and A. J. Kowaltowski. 2004. Higher respiratory activity decreases mitochondrial reactive oxygen release and increases life span in Saccharomyces cerevisiae. J. Biol. Chem. 279:49883-49888. - PubMed
    1. Boveris, A., N. Oshino, and B. Chance. 1972. The cellular production of hydrogen peroxide. Biochem. J. 128:617-630. - PMC - PubMed

Publication types

MeSH terms