. 2006 Aug;173(4):2371-81.
doi: 10.1534/genetics.105.052506. Epub 2006 Jun 18.

Relaxed significance criteria for linkage analysis

Affiliations

Relaxed significance criteria for linkage analysis

Lin Chen et al. Genetics. 2006 Aug.

Abstract

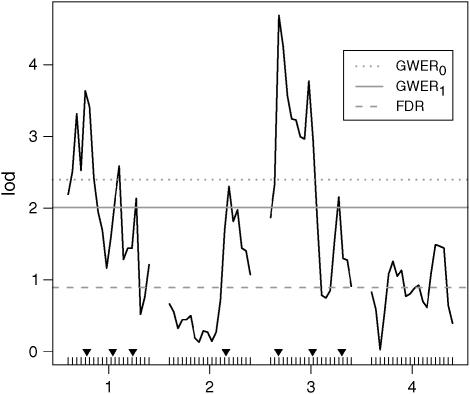
Linkage analysis involves performing significance tests at many loci located throughout the genome. Traditional criteria for declaring a linkage statistically significant have been formulated with the goal of controlling the rate at which any single false positive occurs, called the genomewise error rate (GWER). As complex traits have become the focus of linkage analysis, it is increasingly common to expect that a number of loci are truly linked to the trait. This is especially true in mapping quantitative trait loci (QTL), where sometimes dozens of QTL may exist. Therefore, alternatives to the strict goal of preventing any single false positive have recently been explored, such as the false discovery rate (FDR) criterion. Here, we characterize some of the challenges that arise when defining relaxed significance criteria that allow for at least one false positive linkage to occur. In particular, we show that the FDR suffers from several problems when applied to linkage analysis of a single trait. We therefore conclude that the general applicability of FDR for declaring significant linkages in the analysis of a single trait is dubious. Instead, we propose a significance criterion that is more relaxed than the traditional GWER, but does not appear to suffer from the problems of the FDR. A generalized version of the GWER is proposed, called GWERk, that allows one to provide a more liberal balance between true positives and false positives at no additional cost in computation or assumptions.


Figures

F<sc>igure</sc> 1.—
Figure 1.—
A simulated example showing that marker placement has a strong effect on FDR-based significance. Shown are the LOD score profiles under two scenarios, where the exact same single QTL (denoted by the inverted triangle) is present in each case. In scenario A, there are 10 equally spaced markers on each chromosome. In scenario B, there are 50 equally spaced markers on chromosome 1 and 10 on the remaining chromosomes. The LOD score significance cutoff was calculated so that FDR = 5% in both scenarios. In scenario A, the LOD score cutoff is 3.15 (black dashed line), and in scenario B it is 1.52 (gray dashed line). It can be seen that even though the chromosome 1 LOD score profiles are similar in the two scenarios (A, black; B, gray), the LOD score significance cutoff is substantially lower in scenario B. This occurs because all of the markers adjacent to the QTL are counted as “true discoveries,” even though their signal comes from a single QTL.
F<sc>igure</sc> 2.—
Figure 2.—
A simulated example (details in Multiple QTL on a chromosome) showing that GWERk may yield LOD score significance cutoffs that differ substantially from GWER0 and FDR. Shown are the LOD score profiles across four chromosomes for one of the simulated data sets. The QTL are indicated by the inverted solid triangles. The LOD score cutoffs corresponding to controlling GWER0, GWER1, and FDR at level 5% are shown. It can be seen that the GWER1 criterion manages to find all seven QTL, whereas the GWER0 criterion does not. Furthermore, the FDR yields a number of false positives because of its substantially lower LOD score cutoff.

Similar articles

Cited by

References

    1. Benjamini, Y., and Y. Hochberg, 1995. Controlling the false discovery rate: a practical and powerful approach to multiple testing. J. R. Stat. Soc. Ser. B 85: 289–300.
    1. Benjamini, Y., and D. Yekutieli, 2001. The control of the false discovery rate under dependence. Ann. Stat. 29: 1165–1188.
    1. Benjamini, Y., and D. Yekutieli, 2005. Quantitative trait loci analysis using the false discovery rate. Genetics 171: 783–790. - PMC - PubMed
    1. Bennewitz, J., N. Reinsch, V. Guiard, S. Fritz, H. Thomsen et al., 2004. Multiple quantitative trait loci mapping with cofactors and application of alternative variants of the false discovery rate in an enlarged granddaughter design. Genetics 168: 1019–1027. - PMC - PubMed
    1. Brem, R. B., J. D. Storey, J. Whittle and L. Kruglyak, 2005. Genetic interactions between polymorphisms that affect gene expression in yeast. Nature 436: 701–703. - PMC - PubMed

Publication types