

Impulse response of an S-cone pathway in the aging visual system
- PMID: 16783419
- PMCID: PMC2583216
- DOI: 10.1364/josaa.23.001570
Impulse response of an S-cone pathway in the aging visual system
Abstract
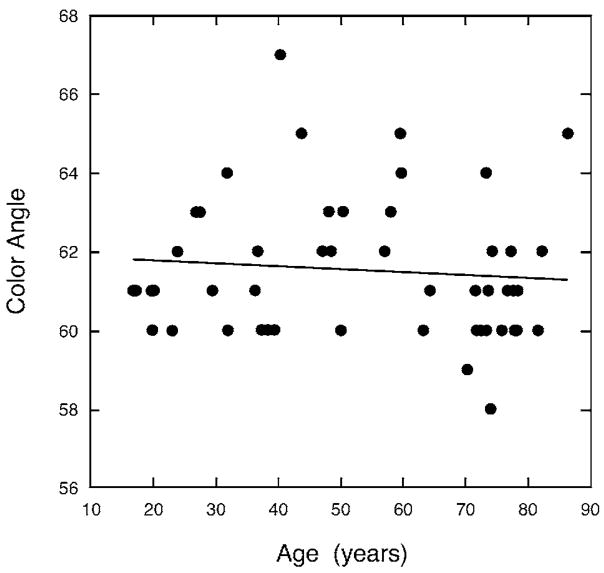
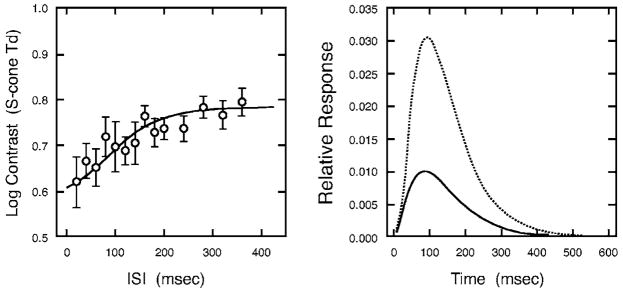
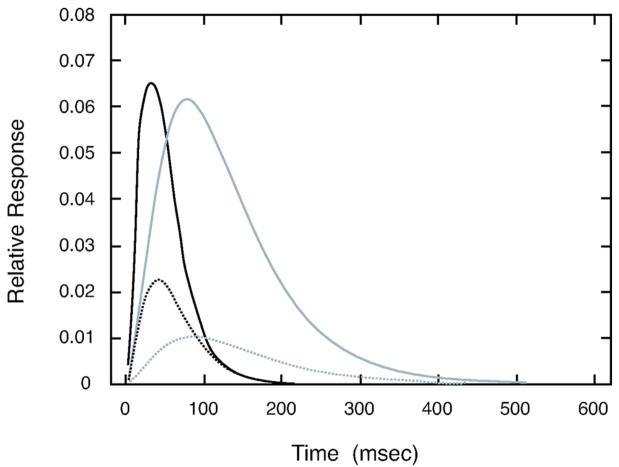
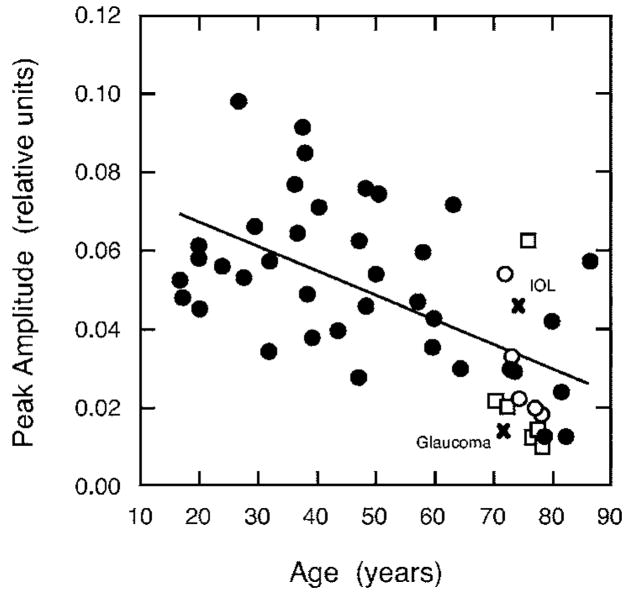
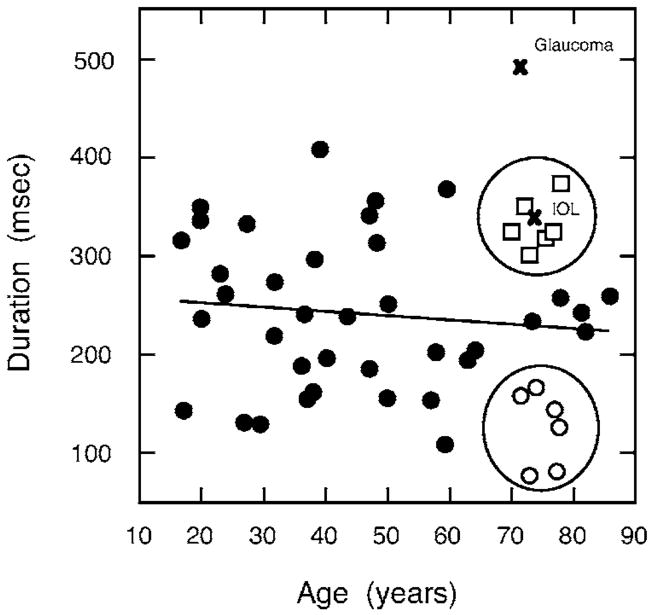
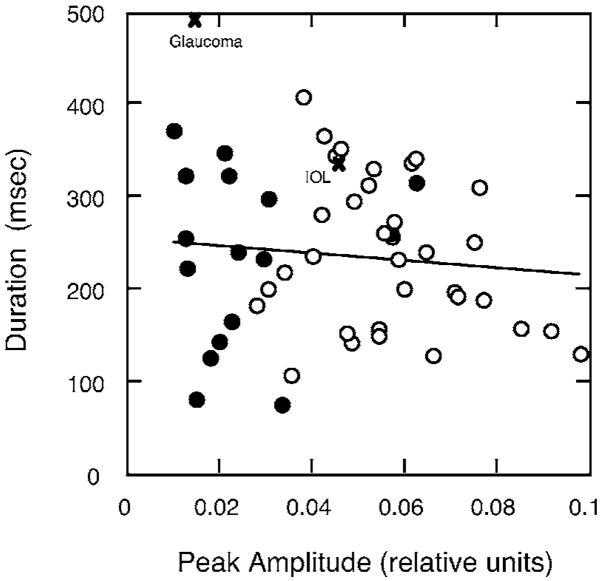
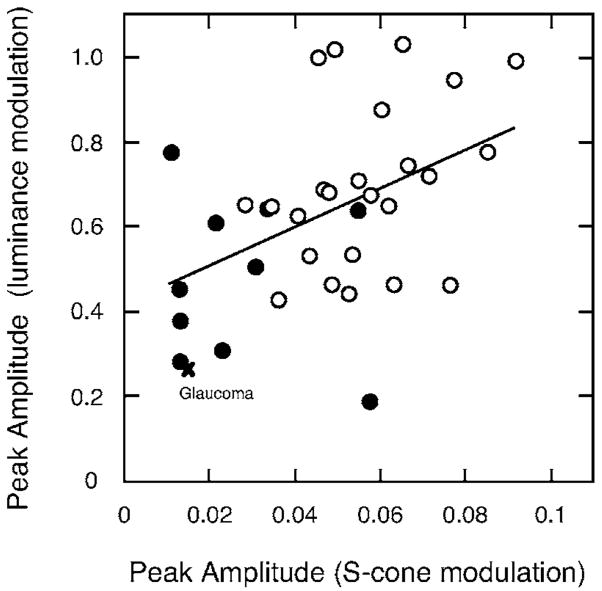
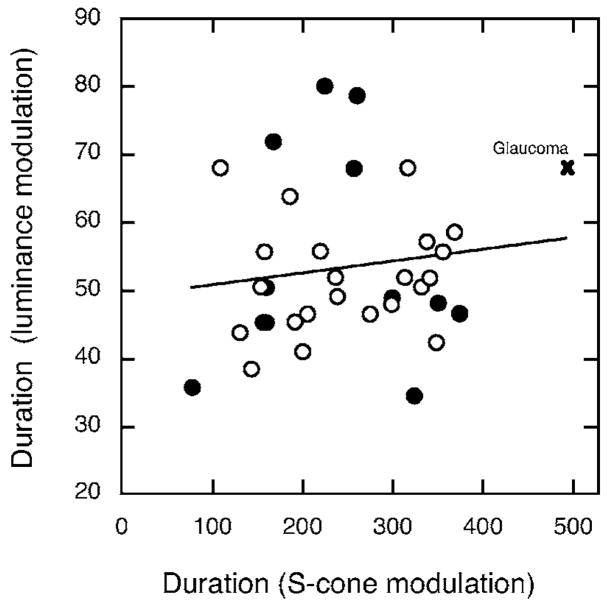
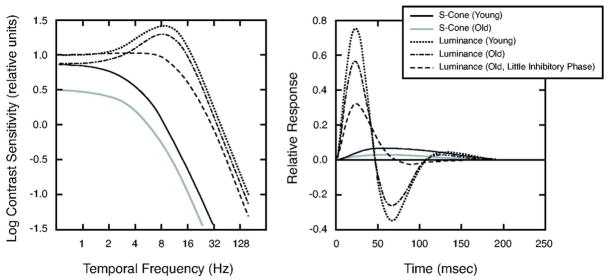
Age-related changes in the temporal properties of an S-cone pathway were characterized by the psychophysical impulse-response function (IRF). Participants included 49 color-normal observers ranging in age from 16.8 to 86.3 years. A double-pulse method was used to measure the IRF with S-cone modulation at constant luminance. Stimuli were presented as a Gaussian patch (+/-1SD = 2.3 degrees ) in one of four quadrants around a central fixation cross on a CRT screen. The test stimulus was modulated from the equal-energy white of the background toward the short-wave spectrum locus. Each of the two pulses (6.67 ms) was separated by an interstimulus interval (ISI) from 20 to 720 ms. Chromatic detection thresholds were determined by a four-alternative forced-choice method with staircases for each ISI in one session. IRFs were calculated from the threshold data using a model with four parameters of an exponentially damped sine wave. S-cone IRFs have only an excitatory phase and a much longer time course compared with IRFs for luminance modulation measured with the same apparatus. The results demonstrated significant age-related losses in IRF amplitude, but the latency (time to peak) of the IRF was stable with age.
Figures
Similar articles
-
The Verriest Lecture: Short-wave-sensitive cone pathways across the life span.J Opt Soc Am A Opt Image Sci Vis. 2016 Mar;33(3):A104-22. doi: 10.1364/JOSAA.33.00A104. J Opt Soc Am A Opt Image Sci Vis. 2016. PMID: 26974914 Free PMC article. Review.
-
The impulse response of S-cone pathways in detection of increments and decrements.Vis Neurosci. 2008 May-Jun;25(3):341-7. doi: 10.1017/S0952523808080218. Epub 2008 Mar 6. Vis Neurosci. 2008. PMID: 18321402 Free PMC article.
-
Age-related changes in ON and OFF responses to luminance increments and decrements.J Opt Soc Am A Opt Image Sci Vis. 2018 Apr 1;35(4):B26-B34. doi: 10.1364/JOSAA.35.000B26. J Opt Soc Am A Opt Image Sci Vis. 2018. PMID: 29603935
-
Senescence of the temporal impulse response to a luminous pulse.Vision Res. 2003 Mar;43(6):617-27. doi: 10.1016/s0042-6989(03)00009-9. Vision Res. 2003. PMID: 12604098 Free PMC article.
-
S-cone psychophysics.Vis Neurosci. 2014 Mar;31(2):211-25. doi: 10.1017/S0952523814000030. Vis Neurosci. 2014. PMID: 24759446 Review.
Cited by
-
Discrimination thresholds of normal and anomalous trichromats: Model of senescent changes in ocular media density on the Cambridge Colour Test.J Opt Soc Am A Opt Image Sci Vis. 2016 Mar;33(3):A65-76. doi: 10.1364/JOSAA.33.000A65. J Opt Soc Am A Opt Image Sci Vis. 2016. PMID: 26974943 Free PMC article.
-
The Verriest Lecture: Short-wave-sensitive cone pathways across the life span.J Opt Soc Am A Opt Image Sci Vis. 2016 Mar;33(3):A104-22. doi: 10.1364/JOSAA.33.00A104. J Opt Soc Am A Opt Image Sci Vis. 2016. PMID: 26974914 Free PMC article. Review.
-
The impact of age-related cataracts on colour perception, postoperative recovery and related spectra derived from test of hue perception.BMC Ophthalmol. 2019 Feb 20;19(1):56. doi: 10.1186/s12886-019-1057-6. BMC Ophthalmol. 2019. PMID: 30786855 Free PMC article.
-
The impulse response of S-cone pathways in detection of increments and decrements.Vis Neurosci. 2008 May-Jun;25(3):341-7. doi: 10.1017/S0952523808080218. Epub 2008 Mar 6. Vis Neurosci. 2008. PMID: 18321402 Free PMC article.
References
-
- Kim CBY, Mayer MJ. Flicker sensitivity in healthy aging eyes. II. Cross-sectional aging trends from 18 through 77 years of age. J Opt Soc Am A. 1994;11:1958–1969. - PubMed
-
- Kline D, Scheiber H. Visual persistence and temporal resolution. In: Sekuler R, Kline D, Dismukes K, Liss AR, editors. Aging and Human Visual Function. 1982. pp. 231–244.
-
- Weale RA. In: A Biography of the Eye. Lewis HK, editor. 1982.
-
- Ikeda M. Temporal summation of positive and negative flashes in the visual system. J Opt Soc Am. 1965;55:1527–1534.
Publication types
MeSH terms
Grants and funding
LinkOut - more resources
Full Text Sources
Other Literature Sources
Medical
Research Materials
