Comparative Study
. 2006 Jun 19:5:24.
doi: 10.1186/1476-4598-5-24.

Optimized high-throughput microRNA expression profiling provides novel biomarker assessment of clinical prostate and breast cancer biopsies

Affiliations
Comparative Study

Optimized high-throughput microRNA expression profiling provides novel biomarker assessment of clinical prostate and breast cancer biopsies

Michael D Mattie et al. Mol Cancer. .

Abstract

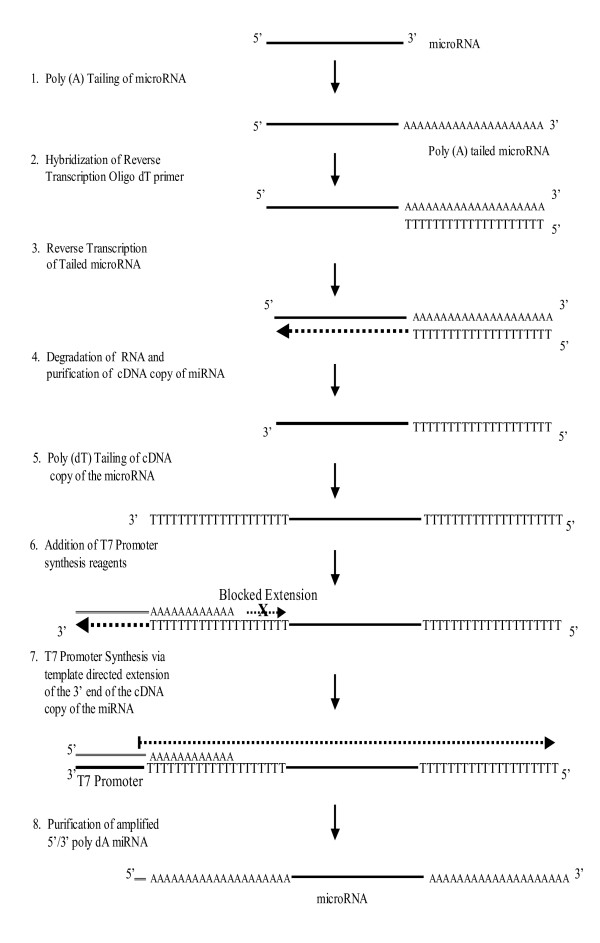
Background: Recent studies indicate that microRNAs (miRNAs) are mechanistically involved in the development of various human malignancies, suggesting that they represent a promising new class of cancer biomarkers. However, previously reported methods for measuring miRNA expression consume large amounts of tissue, prohibiting high-throughput miRNA profiling from typically small clinical samples such as excision or core needle biopsies of breast or prostate cancer. Here we describe a novel combination of linear amplification and labeling of miRNA for highly sensitive expression microarray profiling requiring only picogram quantities of purified microRNA.

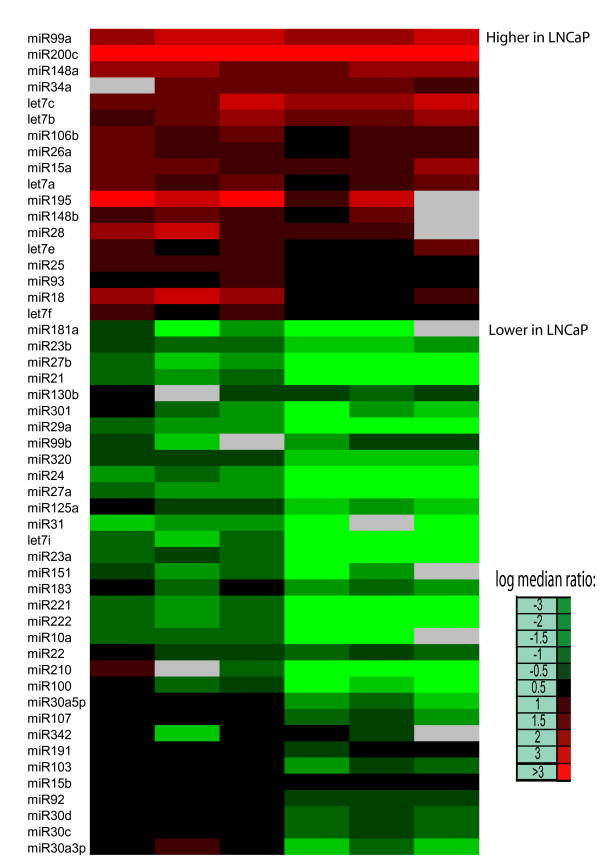
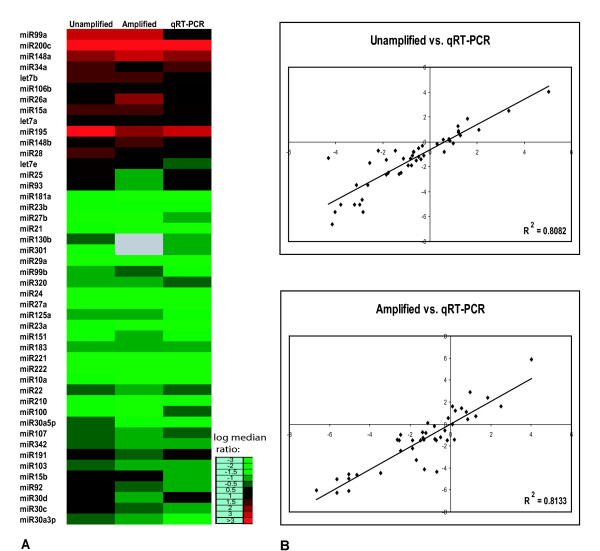
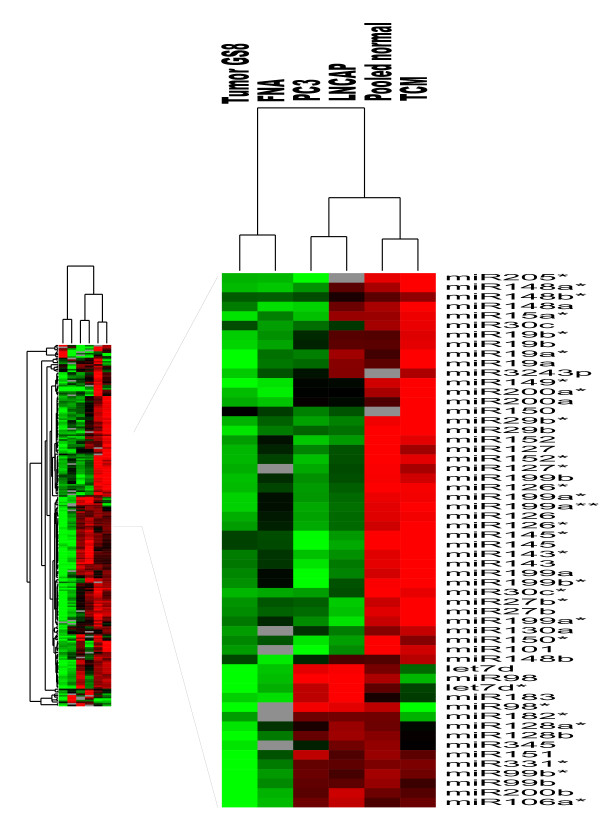
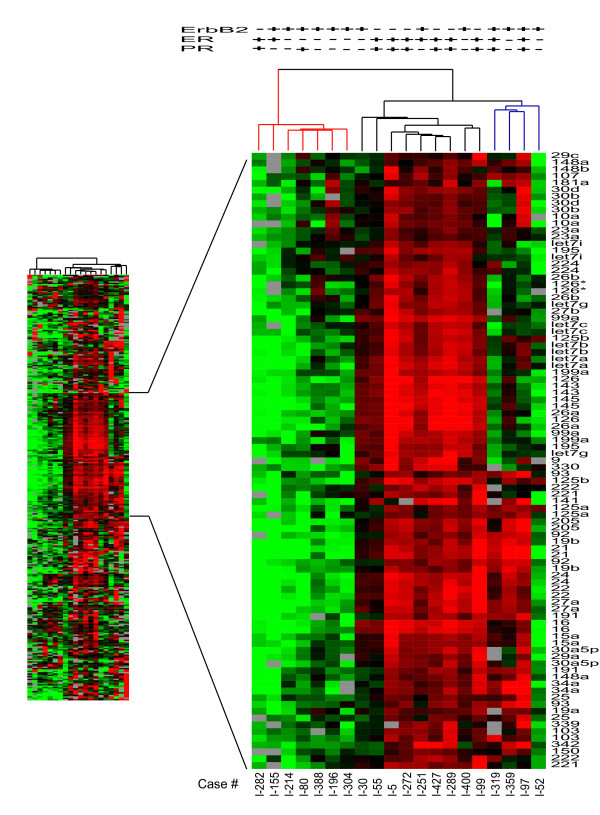
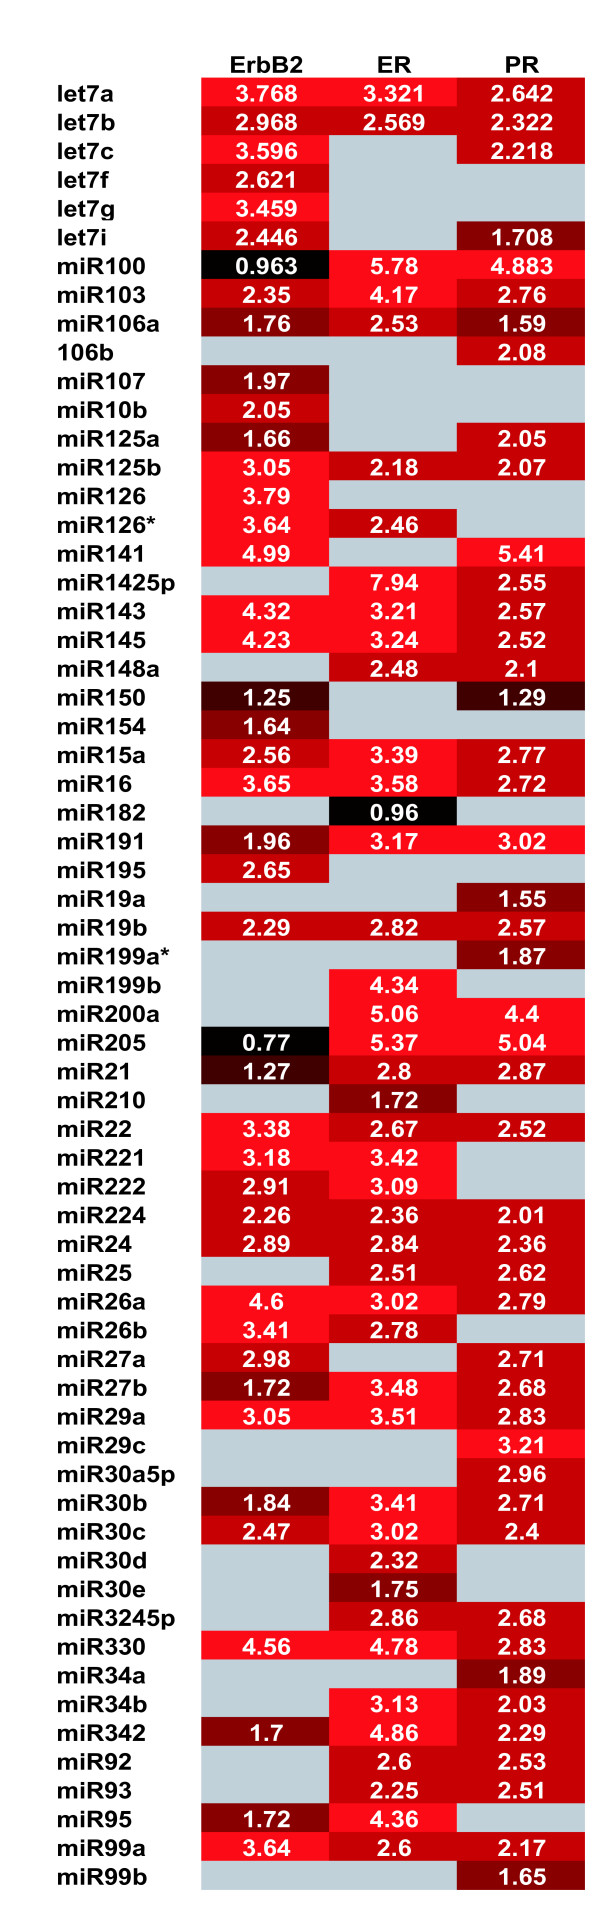
Results: Comparison of microarray and qRT-PCR measured miRNA levels from two different prostate cancer cell lines showed concordance between the two platforms (Pearson correlation R2 = 0.81); and extension of the amplification, labeling and microarray platform was successfully demonstrated using clinical core and excision biopsy samples from breast and prostate cancer patients. Unsupervised clustering analysis of the prostate biopsy microarrays separated advanced and metastatic prostate cancers from pooled normal prostatic samples and from a non-malignant precursor lesion. Unsupervised clustering of the breast cancer microarrays significantly distinguished ErbB2-positive/ER-negative, ErbB2-positive/ER-positive, and ErbB2-negative/ER-positive breast cancer phenotypes (Fisher exact test, p = 0.03); as well, supervised analysis of these microarray profiles identified distinct miRNA subsets distinguishing ErbB2-positive from ErbB2-negative and ER-positive from ER-negative breast cancers, independent of other clinically important parameters (patient age; tumor size, node status and proliferation index).

Conclusion: In sum, these findings demonstrate that optimized high-throughput microRNA expression profiling offers novel biomarker identification from typically small clinical samples such as breast and prostate cancer biopsies.


Figures

Figure 1
Figure 1
Comparison of microRNA expression in PC3 and LNCaP cells by microarray analysis. A heat map of replicate experiments (N = 6) that displays the relative Cy3/Cy5 ratios of microRNAs expressed in PC3(Cy3) vs.LNCaP(Cy5) cells. Expression levels on individual arrays were calculated by averaging the duplicate spots for each miRNA. MicroRNAs are listed in order of significance as determined by SAM analysis. MicroRNA expression is displayed as higher (red) or lower (green) in LNCaP cells in comparison to PC3 cells.
Figure 2
Figure 2
Comparison of microRNA expression measurements by microarray and RT-PCR. A) A heat map comparing the average fold-changes in microRNAs with significantly higher (red) or lower (green) expression in LNCaP cells in comparison to PC3 cells as determined either by Taqman® qRT-PCR or microarray analysis (unamplified and amplified). Genes included in the figure are those found to be significantly different by one or both methods. Mir-130b and miR-301 were not found to be significantly different in amplified samples by SAM analysis. B) Pearson correlation scatter plots of comparisons of array data to qRT-PCR for amplified and unamplified miRNA.
Figure 3
Figure 3
Schematic of microRNA amplification procedure. A poly A tail is first added at the 3' end of microRNAs. Reverse transcription performed using a primer consisting of an oligo dT and a capture sequence. Next, the first strand cDNA is tailed with dTTP using terminal deoxynucleotidyl transferase on the 5' end, followed by annealing of a T7 template oligo to the 3' tail of the cDNA. Klenow enzyme fills in the 3' end of the first strand cDNA to produce a double-stranded T7 promoter. The T7 template contains a blocker to prevent second strand synthesis. An in vitro transcription reaction with T7 RNA polymerase is then performed. Amplified products are then labeled using the method previously mentioned starting at the reverse transcription step.
Figure 4
Figure 4
Unsupervised hierarchical cluster of amplified prostate needle core biopsies. Expression patterns of amplified miRNA from a small set of clinical prostate specimens. Cluster analysis of the microarrays displayed shows a cluster on the left consisting of an advanced needle core biopsy of an advanced prostatic tumor (Gleason score 8) and a fine needle aspirate of a prostatic lymph node metastasis (FNA), a cluster in the middle consisting of PC3 and LNCaP prostate tumor cell lines, and a cluster on the right consisting of a pooled normal adjacent to tumor sample and another sample consisting of transitional cell metaplasia (TCM), an early precursor lesion.
Figure 5
Figure 5
Unsupervised hierarchical cluster of breast tumor samples. The tree was generated by cluster analysis of all 20 breast tumor tissue samples and displays the clinical pathologic features for ErbB2, estrogen receptor (ER), progesterone receptor (PR), and p53 (w = wild type, m = mutant). Cluster analysis revealed three distinct branches of the dendrogram. Duplicate spots for each probe are displayed and were not averaged for this analysis to demonstrate the consistency of expression values between duplicate spots. The probe sequence for mir-126* is distinctively different from mir-126.
Figure 6
Figure 6
Comparison of miRNA expression profiles associated with receptor status. A) Heat map of genes found significantly different according to SAM analysis. Map displays genes significantly higher in ErbB2-negative vs. ErbB2-positive tumors, genes significantly higher in ER-positive vs. ER-negative tumors and genes significantly higher in PR-positive vs. PR-negative tumors.

References

    1. Bartel DP. MicroRNAs: genomics, biogenesis, mechanism, and function. Cell. 2004;116:281–297. doi: 10.1016/S0092-8674(04)00045-5. - DOI - PubMed
    1. Carrington JC, Ambros V. Role of MicroRNAs in Plant and Animal Development. Science. 2003;301:336–338. doi: 10.1126/science.1085242. - DOI - PubMed
    1. Lim LP, Lau NC, Weinstein EG, Abdelhakim A, Yekta S, Rhoades MW, Burge CB, Bartel DP. The microRNAs of Caenorhabditis elegans. Genes & Development. 2003;17:991–1008. doi: 10.1101/gad.1074403. - DOI - PMC - PubMed
    1. Lim LP, Glasner ME, Yekta S, Burge CB, Bartel DP. Vertebrate MicroRNA Genes. Science. 2003;299:1540. doi: 10.1126/science.1080372. - DOI - PubMed
    1. Ambros V. MicroRNA Pathways in Flies and Worms: Growth, Death, Fat, Stress, and Timing. Cell. 2003;113:673–676. doi: 10.1016/S0092-8674(03)00428-8. - DOI - PubMed

Publication types