

Phosphoproteomic analysis of Her2/neu signaling and inhibition
- PMID: 16785428
- PMCID: PMC1502529
- DOI: 10.1073/pnas.0603948103
Phosphoproteomic analysis of Her2/neu signaling and inhibition
Abstract
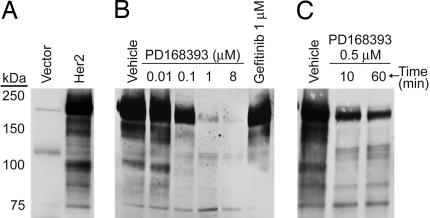
Her2/neu (Her2) is a tyrosine kinase belonging to the EGF receptor (EGFR)/ErbB family and is overexpressed in 20-30% of human breast cancers. We sought to characterize Her2 signal transduction pathways further by using MS-based quantitative proteomics. Stably transfected cell lines overexpressing Her2 or empty vector were generated, and the effect of an EGFR and Her2 selective tyrosine kinase inhibitor, PD168393, on these cells was characterized. Quantitative measurements were obtained on 462 proteins by using the SILAC (stable isotope labeling with amino acids in cell culture) method to monitor three conditions simultaneously. Of these proteins, 198 showed a significant increase in tyrosine phosphorylation in Her2-overexpressing cells, and 81 showed a significant decrease in phosphorylation. Treatment of Her2-overexpressing cells with PD168393 showed rapid reversibility of the majority of the Her2-triggered phosphorylation events. Phosphoproteins that were identified included many known Her2 signaling molecules as well as known EGFR signaling proteins that had not been previously linked to Her2, such as Stat1, Dok1, and delta-catenin. Importantly, several previously uncharacterized Her2 signaling proteins were identified, including Axl tyrosine kinase, the adaptor protein Fyb, and the calcium-binding protein Pdcd-6/Alg-2. We also identified a phosphorylation site in Her2, Y877, which is located in the activation loop of the kinase domain, is distinct from the known C-terminal tail autophosphorylation sites, and may have important implications for regulation of Her2 signaling. Network modeling, which combined phosphoproteomic results with literature-curated protein-protein interaction data, was used to suggest roles for some of the previously unidentified Her2 signaling proteins.
Conflict of interest statement
Conflict of interest statement: No conflicts declared.
Figures


Similar articles
-
Epidermal growth factor receptor (HER1) tyrosine kinase inhibitor ZD1839 (Iressa) inhibits HER2/neu (erbB2)-overexpressing breast cancer cells in vitro and in vivo.Cancer Res. 2001 Dec 15;61(24):8887-95. Cancer Res. 2001. PMID: 11751413
-
A phosphoproteomic analysis of the ErbB2 receptor tyrosine kinase signaling pathways.Biochemistry. 2006 Dec 26;45(51):15529-40. doi: 10.1021/bi060971c. Epub 2006 Dec 19. Biochemistry. 2006. PMID: 17176074
-
Phosphoproteomic mass spectrometry profiling links Src family kinases to escape from HER2 tyrosine kinase inhibition.Oncogene. 2011 Oct 6;30(40):4163-74. doi: 10.1038/onc.2011.130. Epub 2011 Apr 18. Oncogene. 2011. PMID: 21499296 Free PMC article.
-
Role of HER2/neu in tumor progression and therapy.Cell Mol Life Sci. 2004 Dec;61(23):2965-78. doi: 10.1007/s00018-004-4277-7. Cell Mol Life Sci. 2004. PMID: 15583858 Free PMC article. Review.
-
Quantitative phosphoproteomic analysis of signaling network dynamics.Curr Opin Biotechnol. 2008 Aug;19(4):404-9. doi: 10.1016/j.copbio.2008.06.006. Epub 2008 Jul 24. Curr Opin Biotechnol. 2008. PMID: 18619541 Free PMC article. Review.
Cited by
-
Estimation of Gene Regulatory Networks.Postdoc J. 2013 Jan;1(1):60-69. Postdoc J. 2013. PMID: 27595119 Free PMC article.
-
Psoriatic arthritis under a proteomic spotlight: application of novel technologies to advance diagnosis and management.Curr Rheumatol Rep. 2015 May;17(5):35. doi: 10.1007/s11926-015-0509-0. Curr Rheumatol Rep. 2015. PMID: 25895652 Review.
-
Bayesian network expansion identifies new ROS and biofilm regulators.PLoS One. 2010 Mar 3;5(3):e9513. doi: 10.1371/journal.pone.0009513. PLoS One. 2010. PMID: 20209085 Free PMC article.
-
High-level expression of a full-length Eph receptor.Protein Expr Purif. 2013 Nov;92(1):112-8. doi: 10.1016/j.pep.2013.08.016. Epub 2013 Sep 10. Protein Expr Purif. 2013. PMID: 24036371 Free PMC article.
-
Clinical targeting of mutated and wild-type protein tyrosine kinases in cancer.Mol Cell Biol. 2014 May;34(10):1722-32. doi: 10.1128/MCB.01592-13. Epub 2014 Feb 24. Mol Cell Biol. 2014. PMID: 24567371 Free PMC article. Review.
References
-
- Yarden Y., Sliwkowski M. X. Nat. Rev. Mol. Cell. Biol. 2001;2:127–137. - PubMed
-
- Slamon D. J., Clark G. M., Wong S. G., Levin W. J., Ullrich A., McGuire W. L. Science. 1987;235:177–182. - PubMed
-
- Spector N. L., Xia W., Burris H., III, Hurwitz H., Dees E. C., Dowlati A., O’Neil B., Overmoyer B., Marcom P. K., Blackwell K., et al. J. Clin. Oncol. 2005;23:2502–2512. - PubMed
-
- Kratchmarova I., Blagoev B., Haack-Sorensen M., Kassem M., Mann M. Science. 2005;308:1472–1477. - PubMed
-
- Zhang Y., Wolf-Yadlin A., Ross P. L., Pappin D. J., Rush J., Lauffenburger D. A., White F. M. Mol. Cell. Proteomics. 2005;4:1240–1250. - PubMed
Publication types
MeSH terms
Substances
Grants and funding
LinkOut - more resources
Full Text Sources
Other Literature Sources
Molecular Biology Databases
Research Materials
Miscellaneous
