. 2006 Jul;4(7):e220.
doi: 10.1371/journal.pbio.0040220.

Dynamics of the central bottleneck: dual-task and task uncertainty

Affiliations

Dynamics of the central bottleneck: dual-task and task uncertainty

Mariano Sigman et al. PLoS Biol. 2006 Jul.

Abstract

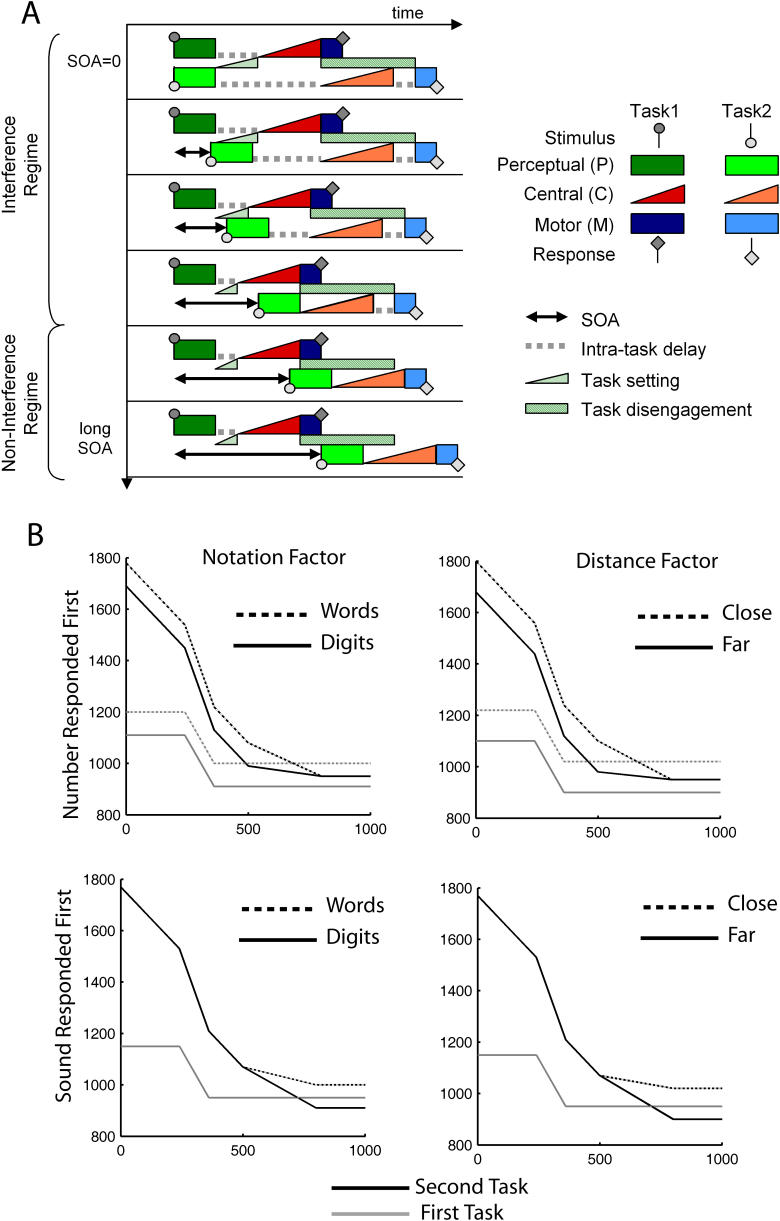
Why is the human brain fundamentally limited when attempting to execute two tasks at the same time or in close succession? Two classical paradigms, psychological refractory period (PRP) and task switching, have independently approached this issue, making significant advances in our understanding of the architecture of cognition. Yet, there is an apparent contradiction between the conclusions derived from these two paradigms. The PRP paradigm, on the one hand, suggests that the simultaneous execution of two tasks is limited solely by a passive structural bottleneck in which the tasks are executed on a first-come, first-served basis. The task-switching paradigm, on the other hand, argues that switching back and forth between task configurations must be actively controlled by a central executive system (the system controlling voluntary, planned, and flexible action). Here we have explicitly designed an experiment mixing the essential ingredients of both paradigms: task uncertainty and task simultaneity. In addition to a central bottleneck, we obtain evidence for active processes of task setting (planning of the appropriate sequence of actions) and task disengaging (suppression of the plan set for the first task in order to proceed with the next one). Our results clarify the chronometric relations between these central components of dual-task processing, and in particular whether they operate serially or in parallel. On this basis, we propose a hierarchical model of cognitive architecture that provides a synthesis of task-switching and PRP paradigms.


Figures

Figure 1
Figure 1. Determinants of Task Choice
(A) Average proportion of trials in which participants responded first to the tone task as a function of SOA. The center of the distribution (50% of responses to each modality) is at 103 ms, indicating that there is a bias to respond first to the number task. The notation manipulation results in a significant change of the 50%SOA (37.8 ms), but the distance manipulation does not. (B) Participant by participant measures of the 50%SOA computed separately as a function of notation and distance. The line corresponds to the identity line. For the notation factor, almost all points lie on one side of the curve, indicating that 50%SOA is systematically larger for Arabic digits. For the distance factor, all values are scattered on both sides of the identity line.
Figure 2
Figure 2. Mean Response Times: A Trace of Different Sources of Interference
(A) Response times to the first and second tasks as a function of SOA. The labels indicate whether the first task corresponds to the number task (mostly for negative SOAs) or to the tone task (mostly for positive SOAs). Two main effects are observed: (1) Responses to the first task are slowed for small SOAs (<400 ms). This increase shows a fairly sharp transition. (2) Response times to the second task decrease linearly for small SOAs, reflecting a processing bottleneck. (B) When the number task is presented and responded to first (top two panels), the manipulations of the number task have an additive effect (independent of SOA). This effect propagates to the tone task. When the tone task is presented and responded to first (bottom two panels), it is not affected by manipulations of the number task (as predicted by a sequential processing model)
Figure 3
Figure 3. Distribution of Response Times for the First and Second Task: Delayed Decision or Inserted Stage?
Distribution of response times to the first task (left) and second task (right). For clarity, all distributions were normalized to a peak of 1. In both cases, the mean response times increase with decreasing SOAs. From the distributions, it is seen that these effects result from qualitatively different changes. Although increases in the second task result from a delayed onset and widening of the distribution (consistent with the insertion of a variable delay in every single trial due to the processing bottleneck), the onset of the distributions of the first task, for different SOAs, is unchanged. The latter indicates that the increase in the mean response times with SOA for RT1 does not result from the inclusion of a processing stage for each trial. Rather, it results either from a variable lengthening of an already-existing decision stage or from the insertion of such a stage on only some proportion of trials.
Figure 4
Figure 4. Standard Deviation and Correlation of the Responses to Both Tasks
(A) Standard deviation of response times to the first and second task, and of the difference in response times. For short SOAs, the response time to the second task is more variable, consistent with a model of accumulation of variance in successive stages. The variance of RT2-RT1 is considerable smaller than the variance of RT1 and RT2 at long SOA indicating a strong correlation between the two responses. (B) An explicit measure of the correlation between RT1 and RT2 shows a monotonic decrease with SOA, but even for a SOA of 1,000 ms, they are strongly correlated. This correlation cannot be accounted for by momentary drifts in participants' attention since the correlation between response times of consecutive trials is 0.08 ± 0.06 ms. (C) The left panel shows a histogram of occurrences of RT2-RT1 as a function of RT1. All the data corresponding to SOA values of −60, 0, or 60 ms (simultaneous or quasi-simultaneous presentation) were grouped and binned in windows of 30 × 30 ms. For reference, a line indicates the value of RT2-RT1 = 150 ms. Almost no responses fall below this line. On the right is shown the histogram and the cumulative distribution of RT2-RT1 (collapsed across all values of RT1).
Figure 5
Figure 5. A Minimal Model for Dual-Task Response Times: Incorporating Task Switching Costs into Sequential Processing Models
(A) Minimal model capable of accounting for the critical observations in our interference paradigm (see Results and Discussion for a more detailed description). Each task consists of three basic processing stages: perceptual (P), central (C), and motor (M) processes. It is assumed that only the central process establishes a bottleneck whereas other stages can be carried out in parallel with stages of another concurrent task [ 8, 24]. Central processes, which are assumed to rely on stochastic evidence accumulation mechanisms and therefore make a major contribution to response-time variability [ 27], are depicted with triangles. Non-decision processes, which have a relatively fixed duration, are depicted with boxes. The model supposes that a first central decision is required to select which task to perform first. We refer to this stage as task setting. We assume that its duration is longer at short SOAs, when both stimuli are in competition, than at long SOAs, when a single stimulus is presented. A second postulate is that there is a temporary inhibition of the response to the second task, implying that it cannot be executed until the first task has been disengaged, as observed in task-switching paradigms [ 14]. We refer to this stage as task disengagement. Note how, during the interference regime, all three central decisional processes (triangles) follow each other in time, indicating saturation of the central system, which causes the observed response delays (dashed lines). Those delays essentially vanish as SOA increases. (B) Pattern of results predicted by the model (same format as in Figure 2B). All the key observations can be fitted with a single set of parameters. The stage durations, in milliseconds, are: P(Number) = 350, P(Tone) = 320, C(Number) = 530, C(Tone) = 580, M(Number) = 50, M(Tone) = 30, Task Disengagement = 600, and Max Task Setting = 200. The fit yields a mean square error (averaged across all conditions) of 42 ms.

Comment in

References

    1. Baars BJ. A cognitive theory of consciousness. Cambridge: Cambridge University Press; 1988. 424 pp.
    1. Baddeley AD. Working memory. Oxford: Clarendon Press; 1986. 289 pp.
    1. Posner MI. Attention: The mechanisms of consciousness. Proc Natl Acad Sci U S A. 1994;91:7398–7403. - PMC - PubMed
    1. Shallice T. From neuropsychology to mental structure. Cambridge: Cambridge University Press; 1988. 462 pp.
    1. Dehaene S, Naccache L. Towards a cognitive neuroscience of consciousness: Basic evidence and a workspace framework. Cognition. 2001;79:1–37. - PubMed

Publication types