. 2006:2:2006.0034.
doi: 10.1038/msb4100074. Epub 2006 Jun 20.

Putative regulatory sites unraveled by network-embedded thermodynamic analysis of metabolome data

Affiliations

Putative regulatory sites unraveled by network-embedded thermodynamic analysis of metabolome data

Anne Kümmel et al. Mol Syst Biol. 2006.

Abstract

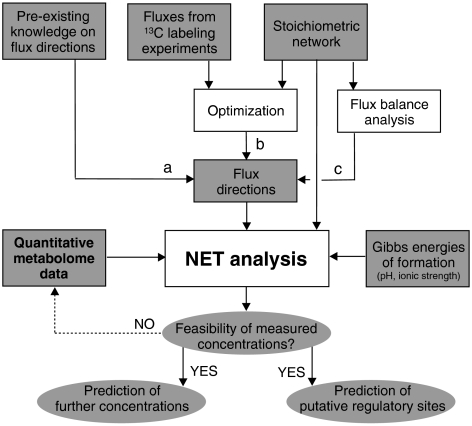
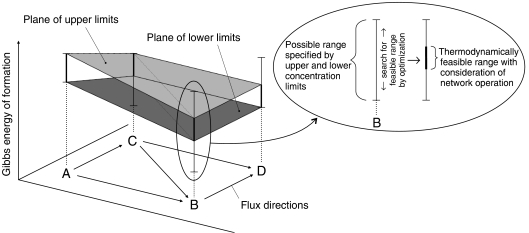
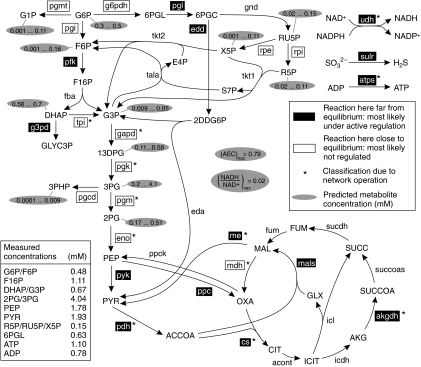
As one of the most recent members of the omics family, large-scale quantitative metabolomics data are currently complementing our systems biology data pool and offer the chance to integrate the metabolite level into the functional analysis of cellular networks. Network-embedded thermodynamic analysis (NET analysis) is presented as a framework for mechanistic and model-based analysis of these data. By coupling the data to an operating metabolic network via the second law of thermodynamics and the metabolites' Gibbs energies of formation, NET analysis allows inferring functional principles from quantitative metabolite data; for example it identifies reactions that are subject to active allosteric or genetic regulation as exemplified with quantitative metabolite data from Escherichia coli and Saccharomyces cerevisiae. Moreover, the optimization framework of NET analysis was demonstrated to be a valuable tool to systematically investigate data sets for consistency, for the extension of sub-omic metabolome data sets and for resolving intracompartmental concentrations from cell-averaged metabolome data. Without requiring any kind of kinetic modeling, NET analysis represents a perfectly scalable and unbiased approach to uncover insights from quantitative metabolome data.


Figures

Figure 1
Figure 1
Illustration of the network-embedded thermodynamic analysis (NET analysis). a, b and c denote alternatives, white and grey boxes are actions and inputs, respectively, and ellipses indicate outputs.
Figure 2
Figure 2
Illustration of the mutual thermodynamic interdependencies of reactions in a network. The presented sample network comprises the reactants A, B, C and D, for which only ranges of concentrations are known. Possible ranges for the reactants' Gibbs energies of formation, taking into account only these concentration ranges, are shown with confined vertical bars. Owing to the provided flux directions and the cooperative action of the reactions in the network, however, the thermodynamically feasible ranges are smaller, which is highlighted by the bold parts of the bars. A flux can only flow from a higher to a lower level of Gibbs energy of formation. Thus, the planes indicating the lower and upper bounds of the thermodynamically feasible Gibbs energies of formation are not allowed to incline against the direction of the flow. The space between the displayed planes, which is defined by the thermodynamic and network-derived constraints (equations (1), 2 and (3)), consists of the thermodynamically feasible Gibbs energies of formation and, thus, describes the feasible concentration space.
Figure 3
Figure 3
Ranges of Gibbs energies of reaction with and without considering the respective reaction's operation in the metabolic network. White bars indicate possible ranges due to the provided concentration ranges (see Materials and methods), whereas the black bars display thermodynamically feasible ranges after introducing the constraints of the reaction network. Abbreviations: me(NADH), malic enzyme (NADH dependent); pdh, pyruvate dehydrogenase; nadk, NAD kinase; akgdh, α-ketoglutarate dehydrogenase; cs, citrate synthase; udh, cytosolic transhydrogenase; atps, ATPase; fba, fructosebisphosphate aldolase; me(NADPH), malic enzyme (NADPH dependent); mdh, malate dehydrogenase; rpi, ribosephosphate isomerase; pgk, phosphoglycerate kinase; gapd, glyceraldehyde 3-phosphate dehydrogenase; tpi, triosephosphate isomerase; pgm, phosphoglycerate mutase; eno, enolase.
Figure 4
Figure 4
NET analysis of the E. coli metabolome data (Schaub et al, 2006). Abbreviations: pgi, glucose 6-phosphate isomerase; pfk, phosphofructose kinase; pyk, pyruvate kinase; g6pdh, glucose 6-phosphate dehydrogenase; pgl, phosphogluconolactonase; gnd, phosphogluconate dehydrogenase; rpe, ribulosephosphate epimerase; tkt1, transketolase; tkt2, transketolase; tala, transaldolase; edd, phosphogluconate dehydratase; eda, phosphogluconate aldolase; acont, acontinase; icdh, isocitrate de-hydrogenase; succoas, succinyl-CoA synthase; sucdh, succinate dehydrogenase; fum, fumerase; icl, isocitrate lyase; mals, malate synthase; ppc, phosphoenolpyruvate carboxylase; ppck, phosphoenolpyruvate carboxykinase; pgmt, phosphoglucomutase; g3pd, glycerol 3-phosphate dehydrogenase; pgcd, phosphoglycerate dehydrogenase; sulr, sulfite reductase; G6P, glucose 6-phosphate; F6P, fructose 6-phosphate; F16P, fructose 1,6-bisphosphate; DHAP, dihydroxyacetone phosphate; G3P, glyceraldehyde 3-phosphate; 13DPG, 1,3-diphosphoglycerate; 3PG, 3-phosphoglycerate; 2PG, 2-phosphoglycerate; PEP, phosphoenolpyruvate; PYR, pyruvate; 6PGL, 6-phosphogluconolactone; 6PGC, 6-phosphogluconate; RU5P, ribulose 5-phosphate; R5P, ribose 5-phosphate; X5P, xylulose 5-phosphate; S7P, seduheptulose 7-phosphate; E4P, erythrose 4-phosphate; 2DDG6P, dehydrodeoxy-6-phosphogluconate; ACCOA, acetyl-CoA; CIT, citrate; ICIT, isocitrate; AKG, α-ketogluterate; SUCCOA, succinyl-CoA; SUCC, succinate; FUM, fumerate; MAL, malate; OXA, oxaloacetate; G1P, glucose 1-phosphate; GLYC3P, glycerol 3-phosphate; 3PHP, 3-phosphohydroxypyruvate; SO32−, sulfide; H2S, hydrogen sulfide. (Summation of the inferred concentration ranges of the pooled metabolites (e.g. 2PG and 3PG) can exceed the actually measured (pooled) concentration of these metabolites. The reason for this is the introduced uncertainty in the measured concentrations of these pooled metabolites (in order to account for potential measurement uncertainties).)

Comment in

References

    1. Alberty RA (2003) Thermodynamics of Biochemical Reactions. Hoboken, NJ, USA: John Wiley & Sons Inc
    1. Bakker BM, Overkamp KM, van Maris AJ, Kötter P, Luttik MA, van Dijken JP, Pronk JT (2001) Stoichiometry and compartmentation of NADH metabolism in Saccharomyces cerevisiae. FEMS Microbiol Rev 25: 15–37 - PubMed
    1. Beard DA, Liang SD, Qian H (2002) Energy balance for analysis of complex metabolic networks. Biophys J 83: 79–86 - PMC - PubMed
    1. Beard DA, Qian H (2005) Thermodynamic-based computational profiling of cellular regulatory control in hepatocyte metabolism. Am J Physiol Endocrinol Metab 288: 633–644 - PubMed
    1. Berg JM, Tymoczko JL, Stryer L (2003) Biochemistry. New York, NY, USA: WH Freeman and Company