Comparative Study
. 2006 Jun;2(6):e96.
doi: 10.1371/journal.pgen.0020096. Epub 2006 Jun 23.

The life-cycle of operons

Affiliations
Comparative Study

The life-cycle of operons

Morgan N Price et al. PLoS Genet. 2006 Jun.

Erratum in

  • PLoS Genet. 2006 Jul;2(7):e126

Abstract

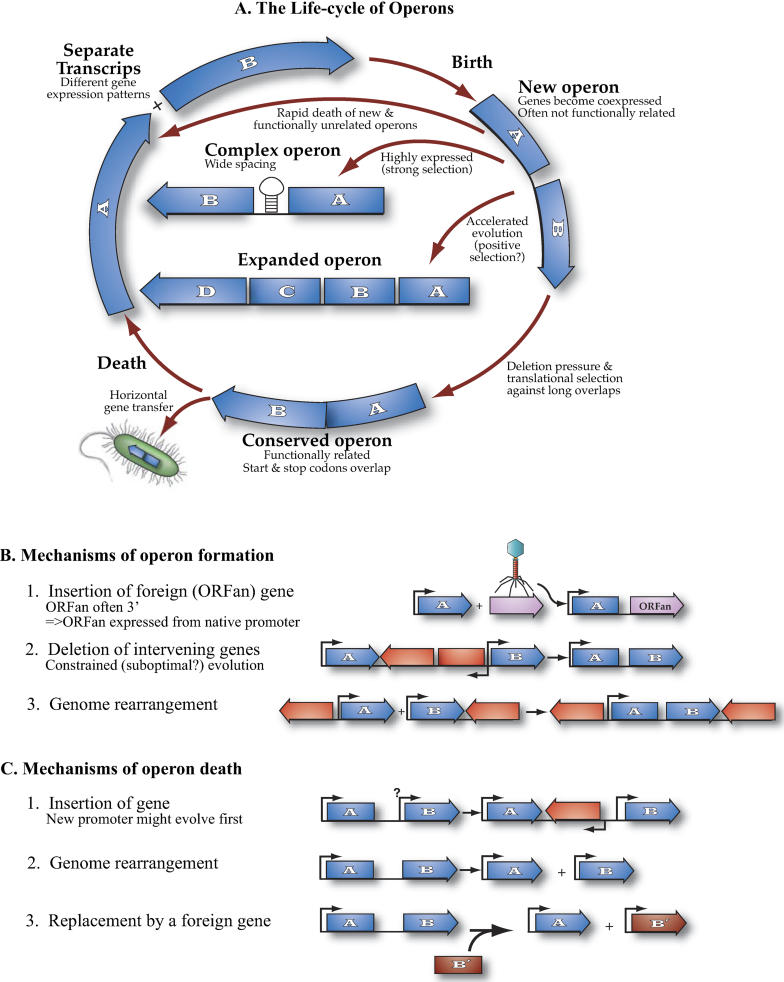
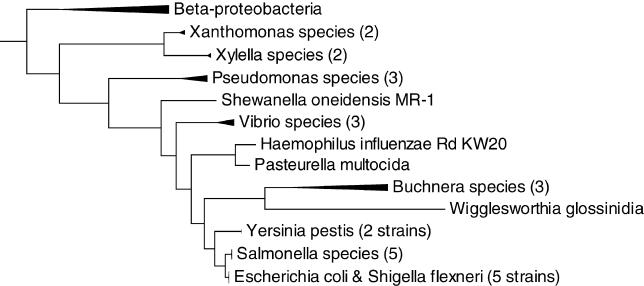
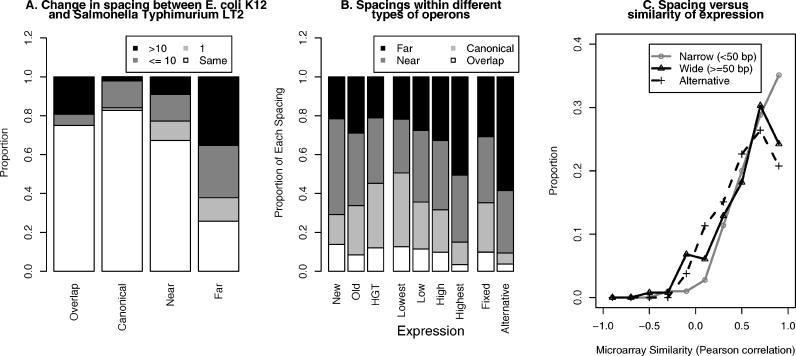
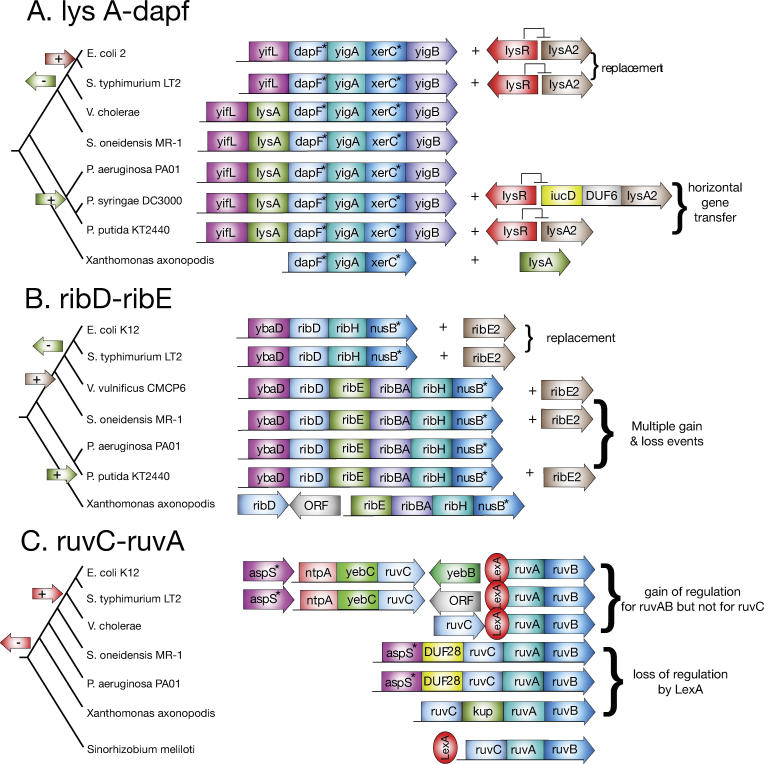
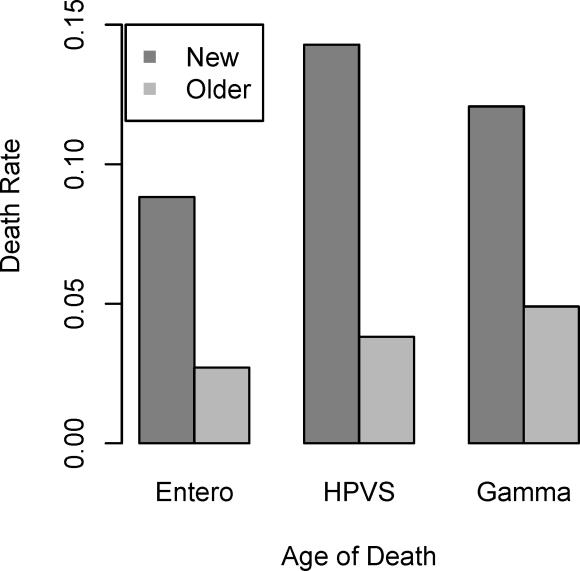
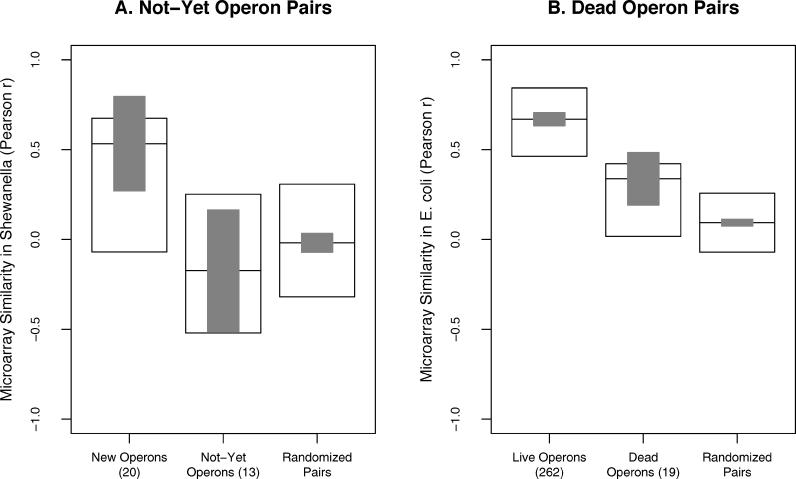
Operons are a major feature of all prokaryotic genomes, but how and why operon structures vary is not well understood. To elucidate the life-cycle of operons, we compared gene order between Escherichia coli K12 and its relatives and identified the recently formed and destroyed operons in E. coli. This allowed us to determine how operons form, how they become closely spaced, and how they die. Our findings suggest that operon evolution may be driven by selection on gene expression patterns. First, both operon creation and operon destruction lead to large changes in gene expression patterns. For example, the removal of lysA and ruvA from ancestral operons that contained essential genes allowed their expression to respond to lysine levels and DNA damage, respectively. Second, some operons have undergone accelerated evolution, with multiple new genes being added during a brief period. Third, although genes within operons are usually closely spaced because of a neutral bias toward deletion and because of selection against large overlaps, genes in highly expressed operons tend to be widely spaced because of regulatory fine-tuning by intervening sequences. Although operon evolution may be adaptive, it need not be optimal: new operons often comprise functionally unrelated genes that were already in proximity before the operon formed.


Conflict of interest statement

Competing interests. The authors have declared that no competing interests exist.

Figures

Figure 1
Figure 1. A Model for Operon Evolution
Figure 2
Figure 2. The Relatives of Escherichia coli K12 Considered in This Study
Distant relatives (other Proteobacteria, Bacteria, and Archaea) are not shown. The tree is based on highly conserved proteins (see Materials and Methods) and is consistent with that of [42] but contains more taxa.
Figure 3
Figure 3. New Operons Often Combine a Native Gene with an “ORFan” Gene That Is Found Only in E. coli and Close Relatives
(A) Types of genes in new operon pairs and in other operon pairs. The enrichment for ORFans in new operon pairs is highly significant (p < 10−15, Fisher exact test). (B) Types of new operon pairs. Only new operon pairs involving native and ORFan genes are shown (there are relatively few HGT genes in the new operons). Within the native–ORFan pairs, we show how often the native gene is upstream of the ORFan, or vice versa. For both the native–ORFan and ORFan–ORFan pairs, we show how often the evolutionary age of the ORFan(s) matches that of the operon. (C) Validation of predicted new operon pairs of each of the three major types. We quantified the similarity of expression patterns in microarray data using the Pearson correlation. As a negative control, we also tested non-operon pairs (adjacent genes on the same strand that are known not to be co-transcribed) from [48].
Figure 4
Figure 4. Accelerated Evolution of Some Operons
(A) New operon pairs are more likely to be adjacent to each other than expected by chance. The surplus of adjacent pairs of the same age is particularly striking. The error bars show 95% confidence intervals from a c2 test of proportions. The model for random evolution is detailed in Materials and Methods. (B) The frequency of different types of modifications to pre-existing operons. The excess of append over prepend pairs is not quite statistically significant (p = 0.06, binomial test).
Figure 5
Figure 5. Spacings between Adjacent Genes in the Same Operon
(A) Known operon pairs in E. coli often have different spacing than the orthologous operon in Salmonella typhimurium LT2. For each class of spacing in E. coli (x-axis), a vertical bar shows the proportion with various amounts of change. (B) The frequency of different types of spacings for operon pairs classified by their evolutionary history (left), their expression level as estimated from microarray data (middle), or whether the operon has an alternative transcript (right). Because operon predictions rely heavily on spacing, only known E. coli operons were used. (C) The distribution of microarray similarity for known operon pairs spaced by less than 50 bp or by more than 50 bp and for alternatively transcribed operon pairs. Operons that are known to be alternatively transcribed were excluded from the “narrow” and “wide” sets.
Figure 6
Figure 6. Reconstructed Histories of Three Dead Operons
For each dead operon pair, we show the gene order and the predicted or known operon structure in E. coli K12 and its relatives. The amount of spacing between genes is not shown. The trees show the branching order of the species according to the tree in Figure 2. We also show a parsimonious reconstruction of events, marked by “+” and “−” on the branches and the labels at right. Genes that are essential for growth in rich media (from [79]) are marked with an asterisk (*).
Figure 7
Figure 7. New Operons Die at Faster Rates
Ancestral operons were identified by their presence in two or more consecutive groups of relatives, and were considered dead if they were no longer in the same operon in E. coli K12. The death rate at a given “age” is the proportion of operons that are present in that group but not in more recent relatives. Here, an operon is considered new at the time of its death if it is present only in the minimum two consecutive groups. In increasing order, the ages are “Entero”—Enterobacteria other than E. coli or Salmonella; “HPVS”—Haemophilus, Pasteurella, Shewanella, and Vibrio species; and “Gamma”—other γ-Proteobacteria. All differences between new and older operons were statistically significant (p < 0.05, Fisher exact test).
Figure 8
Figure 8. Operon Evolution Affects the Pattern of Gene Expression
(A) The distribution of microarray similarity in Shewanella oneidensis MR-1 for new E. coli operon pairs that had “already” formed in Shewanella, for “not-yet” pairs that are far apart in Shewanella but are in newer operons in E. coli, and for randomized pairs of the genes in the latter pairs. For each distribution, the box shows the median and first and third quartiles, and the grey bar shows a 90% confidence interval for the median, so that if two bars do not overlap then the difference in medians is significant (p < 0.05). (B) The distribution of microarray similarity in E. coli K12 for “live” new operon pairs that are conserved in Shewanella, for “dead” operon pairs of similar age that are far apart in E. coli K12, and for randomized pairs of the latter genes. For both (A) and (B), t tests gave similar results for significance (unpublished data).

References

    1. Wolf Y, Rogozin IB, Kondrashov AS, Koonin EV. Genome alignment, evolution of prokaryotic genome organization, and prediction of gene function using genomic context. Genome Res. 2001;11:356–72. - PubMed
    1. Ermolaeva MD, White O, Salzberg SL. Prediction of operons in microbial genomes. Nucleic Acids Res. 2001;29:1216–21. - PMC - PubMed
    1. Price MN, Huang KH, Alm EJ, Arkin AP. A novel method for accurate operon predictions in all sequenced prokaryotes. Nucleic Acids Res. 2005;33:880–892. - PMC - PubMed
    1. de Daruvar A, Collado-Vides J, Valencia A. Analysis of the cellular functions of Escherichia coli operons and their conservation in Bacillus subtilis. J Mol Evol. 2002;55:211–221. - PubMed
    1. Rogozin IB, Makarova KS, Murvai J, Czabarka E, Wolf YI, et al. Connected gene neighborhoods in prokaryotic genomes. Nucleic Acids Res. 2002;30:2212–2223. - PMC - PubMed

Publication types

MeSH terms