. 2006 Jun;2(6):e92.
doi: 10.1371/journal.pgen.0020092. Epub 2006 Jun 9.

Exploring the mycobacteriophage metaproteome: phage genomics as an educational platform

Affiliations

Exploring the mycobacteriophage metaproteome: phage genomics as an educational platform

Graham F Hatfull et al. PLoS Genet. 2006 Jun.

Abstract

Bacteriophages are the most abundant forms of life in the biosphere and carry genomes characterized by high genetic diversity and mosaic architectures. The complete sequences of 30 mycobacteriophage genomes show them collectively to encode 101 tRNAs, three tmRNAs, and 3,357 proteins belonging to 1,536 "phamilies" of related sequences, and a statistical analysis predicts that these represent approximately 50% of the total number of phamilies in the mycobacteriophage population. These phamilies contain 2.19 proteins on average; more than half (774) of them contain just a single protein sequence. Only six phamilies have representatives in more than half of the 30 genomes, and only three-encoding tape-measure proteins, lysins, and minor tail proteins-are present in all 30 phages, although these phamilies are themselves highly modular, such that no single amino acid sequence element is present in all 30 mycobacteriophage genomes. Of the 1,536 phamilies, only 230 (15%) have amino acid sequence similarity to previously reported proteins, reflecting the enormous genetic diversity of the entire phage population. The abundance and diversity of phages, the simplicity of phage isolation, and the relatively small size of phage genomes support bacteriophage isolation and comparative genomic analysis as a highly suitable platform for discovery-based education.


Conflict of interest statement

Competing interests. The authors have declared that no competing interests exist.

Figures

Figure 1
Figure 1. Nucleotide Sequence Comparison of 30 Mycobacteriophage Genomes as Illustrated in a Dotter Plot Using a Sliding Window of 25 bp [63]
The lower triangle represents the relationships at an elevated level of gray-scale relative to the upper triangle, revealing weaker sequence relationships.
Figure 2
Figure 2. Size and Distribution of Mycobacteriophage Phamilies
All 3,357 mycobacteriophage genes were assorted into 1,536 phamilies based on amino acid sequence similarity with a BLAST E value of 0.001 or better to at least one other member of the phamily. (A) The distribution of phamilies is shown ranked according to the number of mycobacteriophage genomes containing at least one phamily member. Examples of specific phams and the total number of mycobacteriophage genes within that pham are shown. (B) Pie-chart representation of the phamily-size distribution. Phamilies with eight or more members represent about 2% of the total.
Figure 3
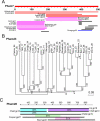
Figure 3. Complex Relationships within Highly Abundant Mycobacteriophage Phamilies
(A) Complex relationships among members of the Pham7 (Lysin A) phamily. The output of a BLAST comparison of Wildcat gp49 against other mycobacteriophage proteins shows that only 16 other mycobacteriophage proteins are matched and that these correspond to different parts of Wildcat gp49. Colored bars represent the strength of the matches, with red being the strongest, followed by purple, blue, and black. (B) Phylogenetic relationships between members of mycobacteriophage Pham23 (tape-measure protein; Tmp). Amino acid sequences for each of the 30 constituent members of Pham23 were aligned using ClustalW and the unrooted phylogenetic relationships represented using NJTree. Bootstrap values from 1,000 reiterations are shown. (C) Chimerism in Pham28 (minor tail) proteins. Llij gp18 is related to both gp18 and gp19 of phage Che8 at high levels of amino acid sequence identity, and these proteins are related in turn to other members of Pham28 as shown.
Figure 4
Figure 4. Representation of Mycobacteriophage Clusters Using Splitstree
(A) The relationships between 30 mycobacteriophages are represented by Splitstree representation of a dataset in which each of the 1,536 gene phamilies is annotated as being either present or absent in each of the 30 genomes. Clusters A through F of genomes that are more closely-related to each other than to other mycobacteriophages are shown by colored circles. (B) The distribution of the members of six phamilies on the Splitstree representation in (A) illustrates that individual phamilies have notably different evolutionary histories than the aggregate representation.
Figure 5
Figure 5. Phamily Circle Representations of Phamily Relationships
All 30 genomes are shown around the circumference, and the phamily members are linked by a line with the width representing the degree of similarity. Phamily circles of Pham58 (upper left), Pham61 and Pham1072 (upper right), and Pham137 and Pham993 (lower right) are shown using different colors for different Phams. Pham216 (bottom left) is shown in turquoise, with the intein present within the Omega phamily member (which has a different set of relationships) shown in purple.
Figure 6
Figure 6. Estimating the Number of Mycobacteriophage Phams
A subset of the 30 phages was randomly selected without replacement, and the total number of Phams was determined; this was repeated 10,000 times with the mean shown as a blue circle. For each subset, an additional phage was then randomly chosen, and the average number of new Phams found in that phage was determined; these data are shown as red squares. The total number of Phams was fit to a hyperbolic function, with the best-fit equation determined by least-squares regression.
Figure 7
Figure 7. Relationships between Mycobacteriophage Phams and Previously Sequenced Proteins
The number and size of mycobacteriophage phamilies with sequence similarity to nonmycobacteriophage genes are shown. The numbers of Phams shared by mycobacteriophages, other phages, and nonphage genomes are shown, along with the average pham size, defined as the number of mycobacteriophage genomes containing at least one member of that phamily. The red circle represents mycobacteriophage genomes, the green circle represents all dsDNA phage genomes other than the mycobacteriophages, and the blue circle represents all nonphage genomes. The number of phams shared between these groups and the mean mycobacteriophages pham size of those phams are shown, with arrows indicating whether they are shared by mycobacteriophages (red circle), nonmycobacteriophage phage genomes (green circle), or nonphage genomes (blue circle).

References

    1. Suttle CA. Viruses in the sea. Nature. 2005;437:356–361. - PubMed
    1. Wommack KE, Colwell RR. Virioplankton: Viruses in aquatic ecosystems. Microbiol Mol Biol Rev. 2000;64:69–114. - PMC - PubMed
    1. Hambly E, Suttle CA. The viriosphere, diversity, and genetic exchange within phage communities. Curr Opin Microbiol. 2005;8:444–450. - PubMed
    1. Fuhrman JA. Marine viruses and their biogeochemical and ecological effects. Nature. 1999;399:541–548. - PubMed
    1. Wilhelm SW, Suttle CA. Viruses and nutrient cycles in the sea. Bioscience. 1999;49:781–788.

Publication types