. 2006 Jul;2(7):e115.
doi: 10.1371/journal.pgen.0020115.eor. Epub 2006 Jun 9.

Transcriptional profiling of aging in human muscle reveals a common aging signature

Affiliations

Transcriptional profiling of aging in human muscle reveals a common aging signature

Jacob M Zahn et al. PLoS Genet. 2006 Jul.

Abstract

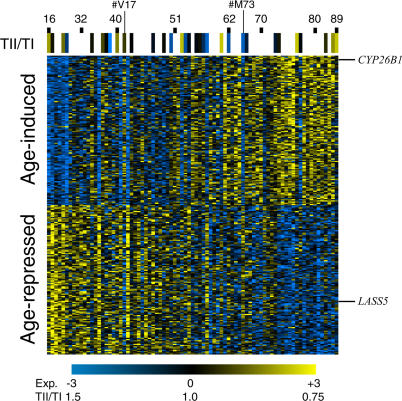
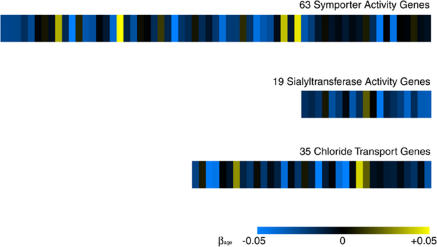
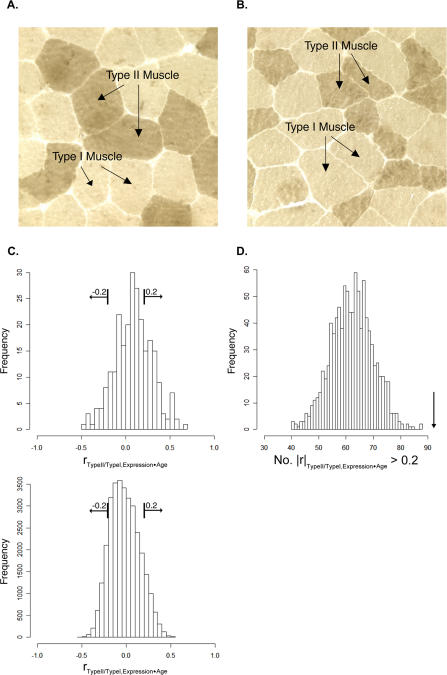
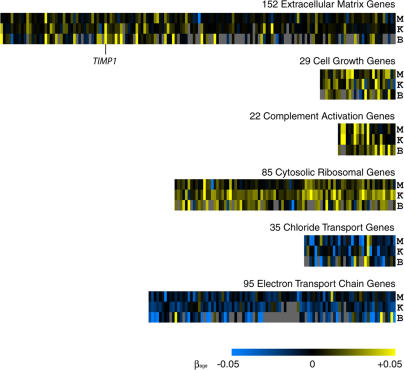
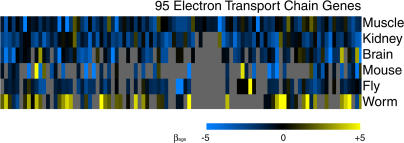
We analyzed expression of 81 normal muscle samples from humans of varying ages, and have identified a molecular profile for aging consisting of 250 age-regulated genes. This molecular profile correlates not only with chronological age but also with a measure of physiological age. We compared the transcriptional profile of muscle aging to previous transcriptional profiles of aging in the kidney and the brain, and found a common signature for aging in these diverse human tissues. The common aging signature consists of six genetic pathways; four pathways increase expression with age (genes in the extracellular matrix, genes involved in cell growth, genes encoding factors involved in complement activation, and genes encoding components of the cytosolic ribosome), while two pathways decrease expression with age (genes involved in chloride transport and genes encoding subunits of the mitochondrial electron transport chain). We also compared transcriptional profiles of aging in humans to those of the mouse and fly, and found that the electron transport chain pathway decreases expression with age in all three organisms, suggesting that this may be a public marker for aging across species.


Conflict of interest statement

Competing interests. The authors have declared that no competing interests exist.

Figures

Figure 1
Figure 1. Expression of 250 Age-Regulated Genes in Muscle
Rows correspond to individual genes, arranged in order from greatest increase in expression with age at top to greatest decrease in expression with age at bottom. Columns represent individual patients, from youngest at left to oldest at right. Ages of certain individuals are marked for reference. Scale represents log2 expression level (Exp). Genes discussed in the text are marked for reference. A navigable version of this figure showing identities of specific genes can be found at http://cmgm.stanford.edu/~kimlab/aging_muscle.
Figure 2
Figure 2. Three Gene Sets Are Regulated with Age in Muscle
Rows represent the symporter activity, sialyltransferase activity, and chloride transport gene sets. Columns correspond to individual genes within a given gene set. Scale represents the slope of the change in log2 expression level with age (β1j). A navigable version of this figure showing identities of specific genes can be found at http://cmgm.stanford.edu/~kimlab/aging_muscle.
Figure 3
Figure 3. Gene Expression Predicts Physiology of Aging
(A) Cross-section of histologically unremarkable deltoid muscle from a 48-y-old woman demonstrating relatively equivalent sizes of types I and II muscle fibers. Arrows denote fibers types as distinguished by enzyme histochemistry (cryosection, 200×, myosin ATPase at pH 9.4). (B) Cross-section of deltoid muscle from an 88-y-old woman demonstrating selective atrophy of type II muscle fibers that stain darkly by ATPase enzyme histochemistry (cryosection, 200×, myosin ATPase at pH 9.4). (C) Histograms showing a correlation between muscle physiology and gene expression for age-regulated genes. Top panel: for each of the 250 age-regulated genes, we calculated the partial correlation coefficients between the type II/type I muscle fiber diameter ratio and gene expression excluding age variation (x-axis). Bottom panel: same as top panel, except that correlation coefficients were calculated for all 31,948 genes. The squared partial correlation coefficient denotes the amount that changes in gene expression account for variance in type II/type I muscle fiber diameter ratios while excluding the effects of age. (D) Histogram showing the likelihood of finding 92 genes with |r| > 0.2 from a set of random genes. We performed a Monte Carlo experiment by randomly selecting sets of 250 genes from the genome, and calculating how many genes in the set had |r| > 0.2 as in (C). The procedure was repeated 1,000 times and the histogram shows the number of genes from each random selection that have |r| > 0.2. The arrow shows the number of genes exceeding this threshold (92) from the set of 250 age-regulated genes (p < 0.001). We also determined the total number of genes in the genome with |r| > 0.2, and then showed that 92 genes from a set of 250 is significant (hypergeometric distribution; p < 1 × 10⁻⁴).
Figure 4
Figure 4. A Common Signature for Aging in Muscle, the Kidney, and the Brain
Shown are expression data from sets of extracellular matrix genes, cell growth genes, complement activation genes, cytosolic ribosomal genes, chloride transport genes, and electron transport chain genes. Rows are human tissues (M, muscle; K, kidney; B, brain). Columns correspond to individual genes in each gene set. Scale represents the slope of the change in log2 expression level with age 1j). Gray indicates genes were not present in the dataset. A navigable version showing identities of specific genes can be found at http://cmgm.stanford.edu/~kimlab/aging_muscle.
Figure 5
Figure 5. The Electron Transport Chain Decreases Expression with Age in Humans, Mice, and Flies
Rows represent either human tissues or model organisms. Columns correspond to individual human genes and homologs to human genes defined by reciprocal best BLAST hits in other species. Scale represents the normalized slope of the change in log2 expression level with age (β1j). Data from different species were normalized by dividing the slope of expression with age by the standard deviation of all similar slopes in the dataset. Gray indicates genes were not present in that species. A navigable version of this figure showing identities of specific genes can be found at http://cmgm.stanford.edu/~kimlab/aging_muscle.

References

    1. Butler RN, Sprott R, Warner H, Bland J, Feuers R, et al. Biomarkers of aging: From primitive organisms to humans. J Gerontol A Biol Sci Med Sci. 2004;59:B560–B567. - PubMed
    1. Miller RA, Chrisp C, Galecki A. CD4 memory T cell levels predict life span in genetically heterogeneous mice. FASEB J. 1997;11:775–783. - PubMed
    1. Miller RA. Biomarkers of aging: Prediction of longevity by using age-sensitive T-cell subset determinations in a middle-aged, genetically heterogeneous mouse population. J Gerontol A Biol Sci Med Sci. 2001;56:B180–B186. - PMC - PubMed
    1. Krishnamurthy J, Torrice C, Ramsey MR, Kovalev GI, Al-Regaiey K, et al. Ink4a/Arf expression is a biomarker of aging. J Clin Invest. 2004;114:1299–1307. - PMC - PubMed
    1. Rodwell GE, Sonu R, Zahn JM, Lund J, Wilhelmy J, et al. A transcriptional profile of aging in the human kidney. PLoS Biol. 2004;2:e427. DOI: 10.1371/journal.pbio.0020427. - DOI - PMC - PubMed

Publication types