. 2006 Jul 22;273(1595):1743-50.
doi: 10.1098/rspb.2005.3462.

Scale-free foraging by primates emerges from their interaction with a complex environment

Affiliations

Scale-free foraging by primates emerges from their interaction with a complex environment

Denis Boyer et al. Proc Biol Sci. .

Abstract

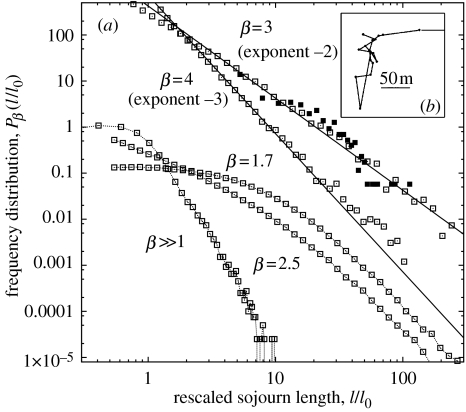
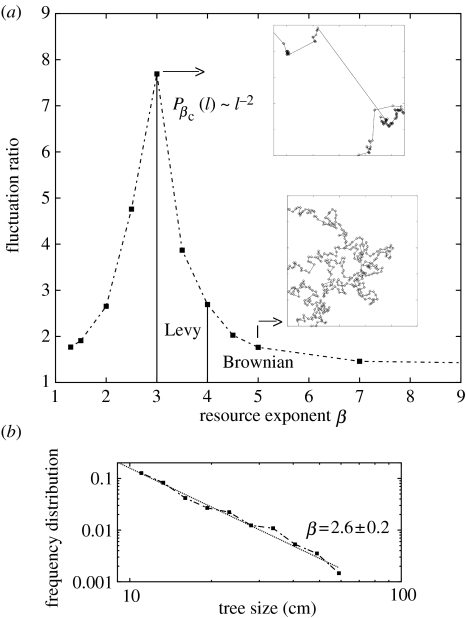
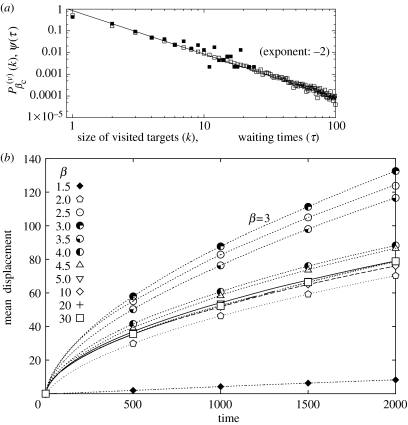
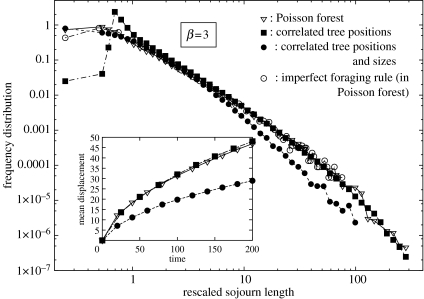
Scale-free foraging patterns are widespread among animals. These may be the outcome of an optimal searching strategy to find scarce, randomly distributed resources, but a less explored alternative is that this behaviour may result from the interaction of foraging animals with a particular distribution of resources. We introduce a simple foraging model where individual primates follow mental maps and choose their displacements according to a maximum efficiency criterion, in a spatially disordered environment containing many trees with a heterogeneous size distribution. We show that a particular tree-size frequency distribution induces non-Gaussian movement patterns with multiple spatial scales (Lévy walks). These results are consistent with field observations of tree-size variation and spider monkey (Ateles geoffroyi) foraging patterns. We discuss the consequences that our results may have for the patterns of seed dispersal by foraging primates.


Figures

Figure 1
Figure 1
(a) Normalized step length distribution Pβ for various resource exponents β, obtained from simulations with N=106 targets in a square domain, and averaged over 10 independent environment realizations (in each run, the number of visited sites is small compared with N). The length l0=N1/2 is the average distance between two nearby targets. The curves β=3 and 4 are translated upward for clarity. Solid lines are inverse power laws l−2 and l−3. The filled squares correspond to the monkeys' foraging patterns collected in the field. (b) Spatial map of a trajectory performed by a spider monkey in the field (detail; see Ramos-Fernández et al. (2004) for details on the field study).
Figure 2
Figure 2
(a) Fluctuation ratio l2/l2 (mean square length to square mean length) associated with the step length distributions Pβ(l) as a function of the resource exponent β. The vertical lines are guides to the eye. Insets: spatial maps of typical trajectories for β=3 (top) and 5 (bottom). (b) Tree-size frequency distribution in semi-evergreen medium forest in La Pantera, in the southeastern Yucatan Peninsula, Mexico. This is the same forest type with the same species composition as the spider monkey study site. Data conform to a power law with exponent β2.6 (±0.2 standard error). Adjustment was performed using a least-squares regression. Data consist of the diameter at breast height of a total of 250 trees ranging from 10 to 63.4 cm. See Cairns et al. (2003) for more details on the study site and procedures. Data were kindly provided by the Centro de Investigación Científica de Yucatán.
Figure 3
Figure 3
(a) Waiting time distribution. Once a monkey has stopped at a tree, it stays there for a time τ before moving to another site. The measured waiting time distribution of spider monkeys in the field is plotted here as filled squares, and is fitted by an inverse power law, ψ(τ)τw with w2.0 (one time unit represents a 5 min interval; see Ramos-Fernández et al. 2004). Also plotted—as open squares—is the distribution Pβ=3(ν)(k) of the size of the targets visited by the walker in the model, at the particular exponent value β=3. We observe Pβ=3(ν)(k)kγ, with the same value γ2.0. One iteration of the model is equivalent to 5 min in the field observations of spider monkeys. (b) Mean displacement of the model walker, |R(t0+t)R(t0)|, as a function of the duration of the walk t. A walker arriving at a target of size k stays there for a time t=k before moving towards the next target at a constant speed (l0 per unit time).
Figure 4
Figure 4
Frequency distribution of the sojourn length given by the different variants of the model as described in appendix A, for β=3. Inset: corresponding mean displacement as a function of time (same legends).

References

    1. Adler F.R, Muller-Landau H.C. When do localized natural enemies increase species richness? Ecol. Lett. 2005;8:438–447. doi:10.1111/j.1461-0248.2005.00741.x - DOI
    1. Atkinson R.P.D, Rhodes C.J, Macdonald D.W, Anderson R.M. Scale-free dynamics in the movement patterns of jackals. Oikos. 2002;98:134–140. doi:10.1034/j.1600-0706.2002.980114.x - DOI
    1. Bartumeus F, da Luz M.G.E, Viswanathan G.M, Catalan J. Animal search strategies: a quantitative random-walk analysis. Ecology. 2005;86:3078–3087.
    1. Binder K, Heermann D.W. Springer; Berlin, Germany: 2002. Monte Carlo simulation in statistical physics.
    1. Bouchaud J.-P, Georges A. Anomalous diffusion in disordered media: statistical mechanisms, models and physical applications. Phys. Rep. 1990;195:127–293. doi:10.1016/0370-1573(90)90099-N - DOI

LinkOut - more resources