. 2006 Jul;74(7):3979-86.
doi: 10.1128/IAI.01657-05.

Previous or ongoing schistosome infections do not compromise the efficacy of the attenuated cercaria vaccine

Affiliations

Previous or ongoing schistosome infections do not compromise the efficacy of the attenuated cercaria vaccine

Thomas M Kariuki et al. Infect Immun. 2006 Jul.

Abstract

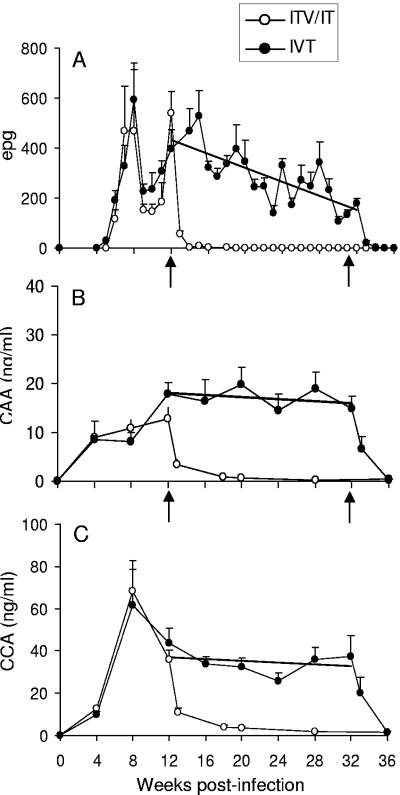
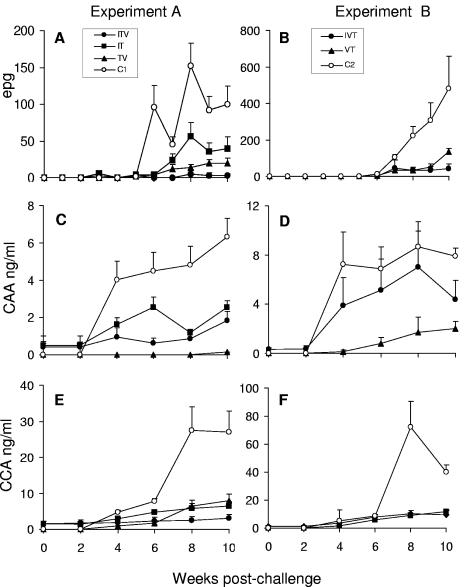
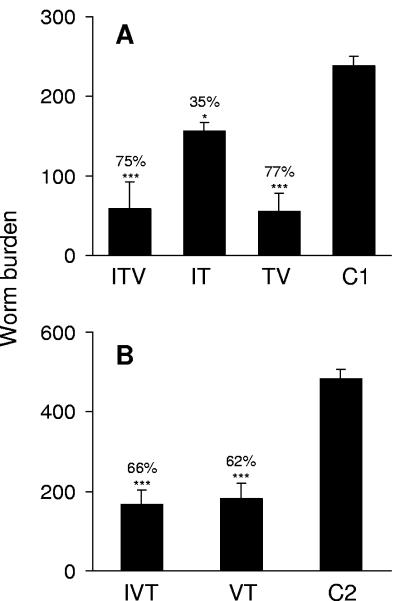
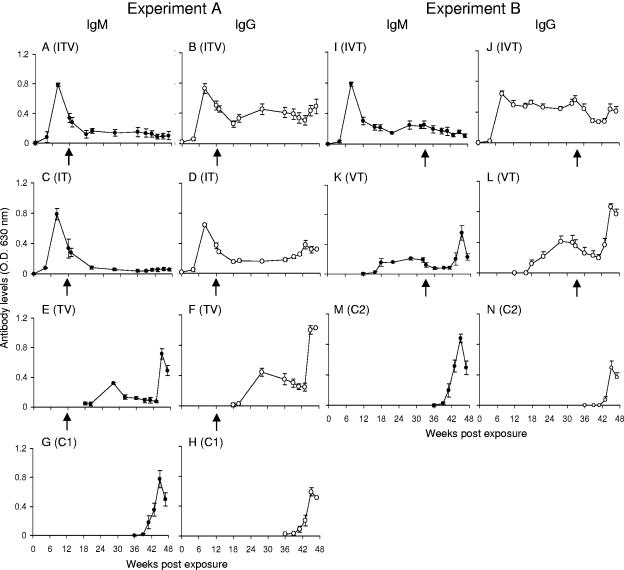
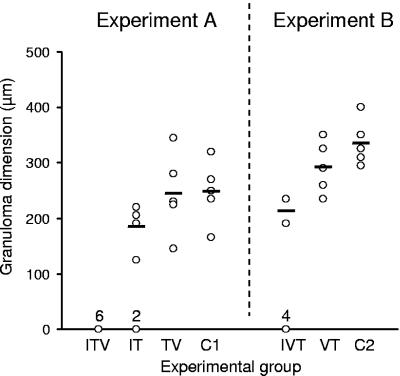
A current or previous schistosome infection might compromise the efficacy of a schistosome vaccine administered to humans. We have therefore investigated the influence of infection on vaccination, using the baboon as the model host and irradiated Schistosoma mansoni cercariae as the vaccine. Protection, determined from worm burdens in test and controls, was not diminished when vaccination was superimposed on a chronic infection, nor was it diminished when it followed a primary infection terminated by chemotherapy. Protection was also assessed indirectly based on fecal egg output and circulating antigen levels, as would be the case in human vaccine trials. In almost all instances, these methods overestimated protection, sometimes with discrepancies of >20%. The overwhelming immune response to egg deposition in infected animals made it difficult to discern a contribution from vaccination. Nevertheless, the well-documented immunomodulation of immune responses that follows egg deposition did not appear to impede the protective mechanisms elicited by vaccination with attenuated cercariae.


Figures

FIG. 1.
FIG. 1.
Infection status of baboons between primary exposure and challenge at 37 weeks, determined by three independent measures: eggs/gm feces (epg) (A), CAA (B), and CCA (C). Experimental groups were ITV and IT plotted as combined data and IVT. PZQ treatment of the ITV and IT groups was at weeks 12 and 13, and the IVT group was treated at weeks 32 and 33 (arrows in panels A and B). Regression analysis was performed on IVT data between weeks 12 and 32: y = −14.1x + 603 (P < 0.005) (A); y = 0.029x + 14.33 (NS) (B); and y = −0.214x + 39.7 (NS) (C). Values are means + the SEM (n = 5 to 7).
FIG. 2.
FIG. 2.
Infection status of baboons from challenge to perfusion, determined by epg (A and B), CAA (C and D), and CCA (E and F). Groups in experiment A (infection, treatment, vaccination, challenge) are plotted in panels A, C, and E, and groups in experiment B (infection, vaccination, treatment, challenge) are plotted in panels B, D, and F. Values are means + SEM (n = 5 to 7).
FIG. 3.
FIG. 3.
Worm burdens after challenge and perfusion for experiment A (infection, treatment, vaccination, challenge) (A) and experiment B (infection, vaccination, treatment, challenge) (B). The percent protection relative to controls is indicated above each bar: ✽✽✽, P < 0.001; ✽✽, P < 0.01; ✽, P < 0.05. Values are means + the SEM (n = 5 to 7).
FIG. 4.
FIG. 4.
Antibody profiles over the whole time course probed by using 0-3hRAP (cercarial secretions). For experiment A (infection, treatment, vaccination, challenge) the IgM levels are plotted in panels A, C, E, and G, and the IgG levels are plotted in panels B, D, F, and H for groups ITV, IT, TV, and C1, respectively. For experiment B (infection, vaccination, treatment, challenge) the IgM levels are plotted in panels I, K, and M and the IgG levels are plotted in panels J, L, and N for groups IVT, VT, and C2, respectively. Five vaccinations were given at 4-week intervals starting at week 18 in experiment A and week 14 in experiment B. PZQ treatment (arrow below x axis) was at weeks 12 and 13 in experiment A and at weeks 32 and 33 in experiment B. Values are means + the SEM (n = 5 to 7).
FIG. 5.
FIG. 5.
Hepatic egg granuloma dimensions at 10 weeks postchallenge for experiment A (infection, treatment, vaccination, challenge) and experiment B (infection, vaccination, treatment, challenge). Circles and solid bars represent individual and mean values, respectively (n = 5 to 7). The number of animals in each group with zero granulomas is depicted above the x axis.

Similar articles

Cited by

References

    1. Ashton, P. D., R. S. Curwen, and R. A. Wilson. 2001. Linking proteome and genome: how to identify parasite proteins. Trends Parasitol. 17:198-202. - PubMed
    1. Butterworth, A. E., P. R. Dalton, D. W. Dunne, M. Mugambi, J. H. Ouma, B. A. Richardson, T. K. Siongok, and R. F. Sturrock. 1984. Immunity after treatment of human schistosomiasis mansoni. I. Study design, pretreatment observations, and the results of treatment. Trans. R. Soc. Trop. Med. Hyg. 78:108-123. - PubMed
    1. Cooper, P. J., I. Espinel, M. Wieseman, W. Paredes, M. Espinel, R. H. Guderian, and T. B. Nutman. 1999. Human onchocerciasis and tetanus vaccination: impact on the postvaccination antitetanus antibody response. Infect. Immun. 67:5951-5957. - PMC - PubMed
    1. Coulson, P. S. 1997. The radiation-attenuated vaccine against schistosomes in animal models: paradigm for a human vaccine? Adv. Parasitol. 39:271-336. - PubMed
    1. Curwen, R. S., P. D. Ashton, D. A. Johnston, and R. A. Wilson. 2004. The Schistosoma mansoni soluble proteome: a comparison across four life-cycle stages. Mol. Biochem. Parasitol. 138:57-66. - PubMed

Publication types

MeSH terms

LinkOut - more resources