. 2006 Jun 22:6:50.
doi: 10.1186/1471-2148-6-50.

Differentiated evolutionary rates in alternative exons and the implications for splicing regulation

Affiliations

Differentiated evolutionary rates in alternative exons and the implications for splicing regulation

Mireya Plass et al. BMC Evol Biol. .

Abstract

Background: Alternatively spliced exons play an important role in the diversification of gene function in most metazoans and are highly regulated by conserved motifs in exons and introns. Two contradicting properties have been associated to evolutionary conserved alternative exons: higher sequence conservation and higher rate of non-synonymous substitutions, relative to constitutive exons. In order to clarify this issue, we have performed an analysis of the evolution of alternative and constitutive exons, using a large set of protein coding exons conserved between human and mouse and taking into account the conservation of the transcript exonic structure. Further, we have also defined a measure of the variation of the arrangement of exonic splicing enhancers (ESE-conservation score) to study the evolution of splicing regulatory sequences. We have used this measure to correlate the changes in the arrangement of ESEs with the divergence of exon and intron sequences.

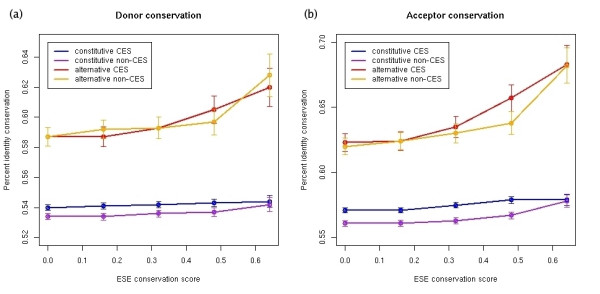
Results: We find evidence for a relation between the lack of conservation of the exonic structure and the weakening of the sequence evolutionary constraints in alternative and constitutive exons. Exons in transcripts with non-conserved exonic structures have higher synonymous (dS) and non-synonymous (dN) substitution rates than exons in conserved structures. Moreover, alternative exons in transcripts with non-conserved exonic structure are the least constrained in sequence evolution, and at high EST-inclusion levels they are found to be very similar to constitutive exons, whereas alternative exons in transcripts with conserved exonic structure have a dS significantly lower than average at all EST-inclusion levels. We also find higher conservation in the arrangement of ESEs in constitutive exons compared to alternative ones. Additionally, the sequence conservation at flanking introns remains constant for constitutive exons at all ESE-conservation values, but increases for alternative exons at high ESE-conservation values.

Conclusion: We conclude that most of the differences in dN observed between alternative and constitutive exons can be explained by the conservation of the transcript exonic structure. Low dS values are more characteristic of alternative exons with conserved exonic structure, but not of those with non-conserved exonic structure. Additionally, constitutive exons are characterized by a higher conservation in the arrangement of ESEs, and alternative exons with an ESE-conservation similar to that of constitutive exons are characterized by a conservation of the flanking intron sequences higher than average, indicating the presence of more intronic regulatory signals.


Figures

Figure 1
Figure 1
Distribution of the percentage identity conservation for each of the four subsets of orthologous exons. The four exon subgroups are defined according to whether the exon is constitutive or alternative, and whether it is part of a transcript with a conserved exonic structure (CES) or not (non-CES).
Figure 2
Figure 2
Distribution of non-synonymous rates (dN) for each of the four subsets of orthologous exons: constitutive and alternative exons with (CES) or without (non-CES) conservation of the exonic structure.
Figure 3
Figure 3
Distribution of the synonymous rates (dS) for each of the four subsets of orthologous exons: constitutive and alternative exons with (CES) or without (non-CES) conservation of the exonic structure.
Figure 4
Figure 4
Average (a) non-synonymous (dN) and (b) synonymous (dS) substitution rates (y-axis) for different minimum percentage identity conservation values (x-axis). For each percentage identity value, we calculate the average dN, dS and corresponding standard error bars, for all the exons of each subgroup having greater or equal identity conservation.
Figure 5
Figure 5
Variation of the (a) synonymous (dS) and (b) non-synonymous (dN) substitution rates for alternative CES and non-CES exons (y-axis) with the EST inclusion level (x-axis). Each average and standard error is calculated for a minimum EST-inclusion expressed as the fraction of ESTs that include the alternative exon. For comparison, we have superimposed the average synonymous rate for all constitutive CES and non-CES exons as a straight line with the corresponding error bars.
Figure 6
Figure 6
(a) ESE conservation score for all exons (blue) compared to the conservation score of random hexamers (orange) for the same exon set. (b) The ESE conservation score is plotted for each exon subgroup (alternative CES and non-CES, and constitutive CES and non-CES). The average and standard error are calculated for different minimum percent identity conservation values of the exon sequences.
Figure 7
Figure 7
Average percent identity conservation in 100 bp of the donor (a) and acceptor (b) sites for constitutive and alternative exons plotted against the ESE conservation score. For each exon subgroup, the average conservation and standard error are calculated for different minimum ESE conservation score values.
Figure 8
Figure 8
Alternative exon (CES type) of the chloride channel 6 isoform CIC-6a (CLCN6, ENSG00000011021) gene aligned to the orthologous exon in mouse. We have omitted 13 bp of alignment that does not contain any ESEs. The H's and M's indicate the human and mouse regulatory regions, respectively.

References

    1. Kriventseva EV, Koch I, Apweiler R, Vingron M, Bork P, Gelfand MS, Sunyaev S. Increase of functional diversity by alternative splicing. Trends Genet. 2003;19:124–8. doi: 10.1016/S0168-9525(03)00023-4. - DOI - PubMed
    1. Xing Y, Xu Q, Lee C. Widespread production of novel soluble protein isoforms by alternative splicing removal of transmembrane anchoring domains. FEBS Lett. 2003;555:572–8. doi: 10.1016/S0014-5793(03)01354-1. - DOI - PubMed
    1. Cline MS, Shigeta R, Wheeler RL, Siani-Rose MA, Kulp D, Loraine AE. The effects of alternative splicing on transmembrane proteins in the mouse genome. Pac Symp Biocomput. 2004:17–28. - PubMed
    1. Modrek B, Lee CJ. Alternative splicing in the human, mouse and rat genomes is associated with an increased frequency of exon creation and/or loss. Nat Genet. 2003;34:177–180. doi: 10.1038/ng1159. - DOI - PubMed
    1. Iida K, Akashi H. A test of translational selection at "silent" sites in the human genome: base composition comparisons in alternatively spliced genes. Gene. 2000;261:93–105. doi: 10.1016/S0378-1119(00)00482-0. - DOI - PubMed

Publication types