

Sustained inflation and incremental mean airway pressure trial during conventional and high-frequency oscillatory ventilation in a large porcine model of acute respiratory distress syndrome
- PMID: 16792808
- PMCID: PMC1526714
- DOI: 10.1186/1471-2253-6-8
Sustained inflation and incremental mean airway pressure trial during conventional and high-frequency oscillatory ventilation in a large porcine model of acute respiratory distress syndrome
Abstract
Background: To compare the effect of a sustained inflation followed by an incremental mean airway pressure trial during conventional and high-frequency oscillatory ventilation on oxygenation and hemodynamics in a large porcine model of early acute respiratory distress syndrome.
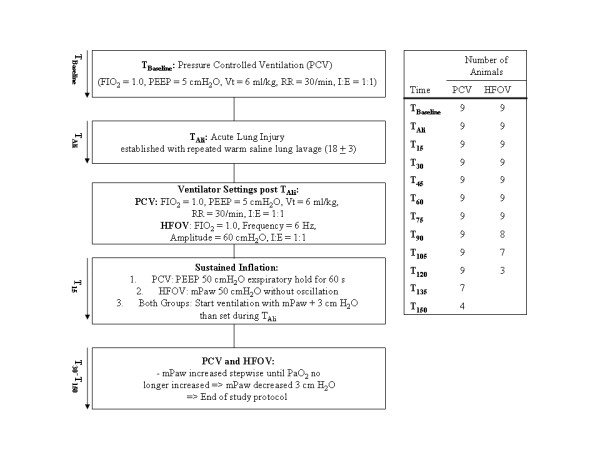
Methods: Severe lung injury (Ali) was induced in 18 healthy pigs (55.3 +/- 3.9 kg, mean +/- SD) by repeated saline lung lavage until PaO2 decreased to less than 60 mmHg. After a stabilisation period of 60 minutes, the animals were randomly assigned to two groups: Group 1 (Pressure controlled ventilation; PCV): FIO2 = 1.0, PEEP = 5 cmH2O, V(T) = 6 ml/kg, respiratory rate = 30/min, I:E = 1:1; group 2 (High-frequency oscillatory ventilation; HFOV): FIO2 = 1.0, Bias flow = 30 l/min, Amplitude = 60 cmH2O, Frequency = 6 Hz, I:E = 1:1. A sustained inflation (SI; 50 cmH2O for 60s) followed by an incremental mean airway pressure (mPaw) trial (steps of 3 cmH2O every 15 minutes) were performed in both groups until PaO2 no longer increased. This was regarded as full lung inflation. The mPaw was decreased by 3 cmH2O and the animals reached the end of the study protocol. Gas exchange and hemodynamic data were collected at each step.
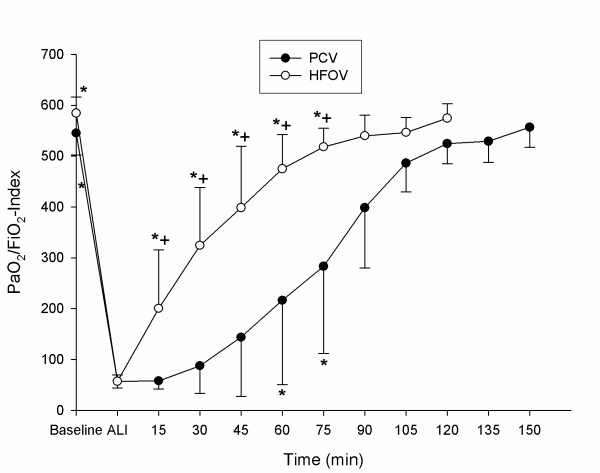
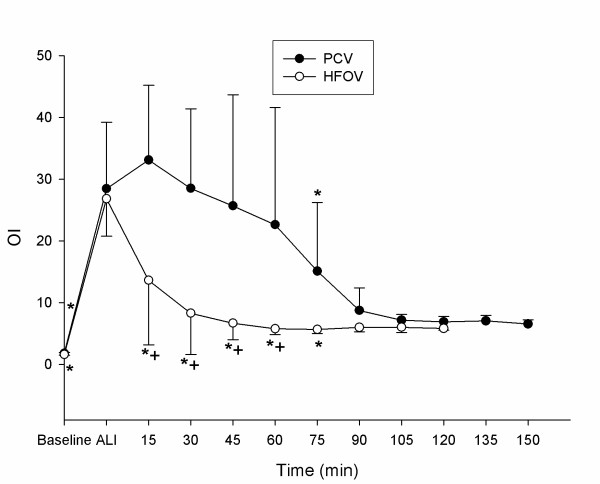
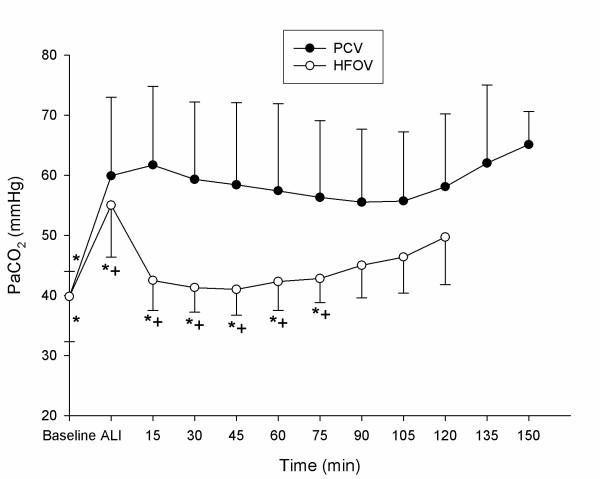
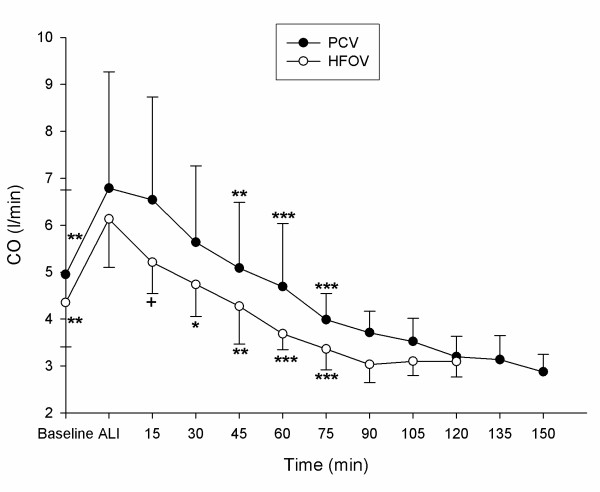
Results: The SI led to a significant improvement of the PaO2/FiO2-Index (HFOV: 200 +/- 100 vs. PCV: 58 +/- 15 and T(Ali): 57 +/- 12; p < 0.001) and PaCO2-reduction (HFOV: 42 +/- 5 vs. PCV: 62 +/- 13 and T(Ali): 55 +/- 9; p < 0.001) during HFOV compared to lung injury and PCV. Augmentation of mPaw improved gas exchange and pulmonary shunt fraction in both groups, but at a significant lower mPaw in the HFOV treated animals. Cardiac output was continuously deteriorating during the recruitment manoeuvre in both study groups (HFOV: T(Ali): 6.1 +/- 1 vs. T(75): 3.4 +/- 0.4; PCV: T(Ali): 6.7 +/- 2.4 vs. T(75): 4 +/- 0.5; p < 0.001).
Conclusion: A sustained inflation followed by an incremental mean airway pressure trial in HFOV improved oxygenation at a lower mPaw than during conventional lung protective ventilation. HFOV but not PCV resulted in normocapnia, suggesting that during HFOV there are alternatives to tidal ventilation to achieve CO2-elimination in an "open lung" approach.
Figures
References
-
- Corbridge TC, Wood LD, Crawford GP, Chudoba MJ, Yanos J, Sznajder JI. Adverse effects of large tidal volume and low PEEP in canine acid aspiration. Am Rev Respir Dis. 1990;142:311–315. - PubMed
-
- Amato MB, Barbas CS, Medeiros DM, Magaldi RB, Schettino GP, Lorenzi-Filho G, Kairalla RA, Deheinzelin D, Munoz C, Oliveira R, Takagaki TY, Carvalho CR. Effect of a protective-ventilation strategy on mortality in the acute respiratory distress syndrome. N Engl J Med. 1998;338:347–354. doi: 10.1056/NEJM199802053380602. - DOI - PubMed
LinkOut - more resources
Full Text Sources
