Comparative Study
. 2006 Jun 21;26(25):6728-36.
doi: 10.1523/JNEUROSCI.0752-06.2006.

Retinal waves trigger spindle bursts in the neonatal rat visual cortex

Affiliations
Comparative Study

Retinal waves trigger spindle bursts in the neonatal rat visual cortex

Ileana L Hanganu et al. J Neurosci. .

Abstract

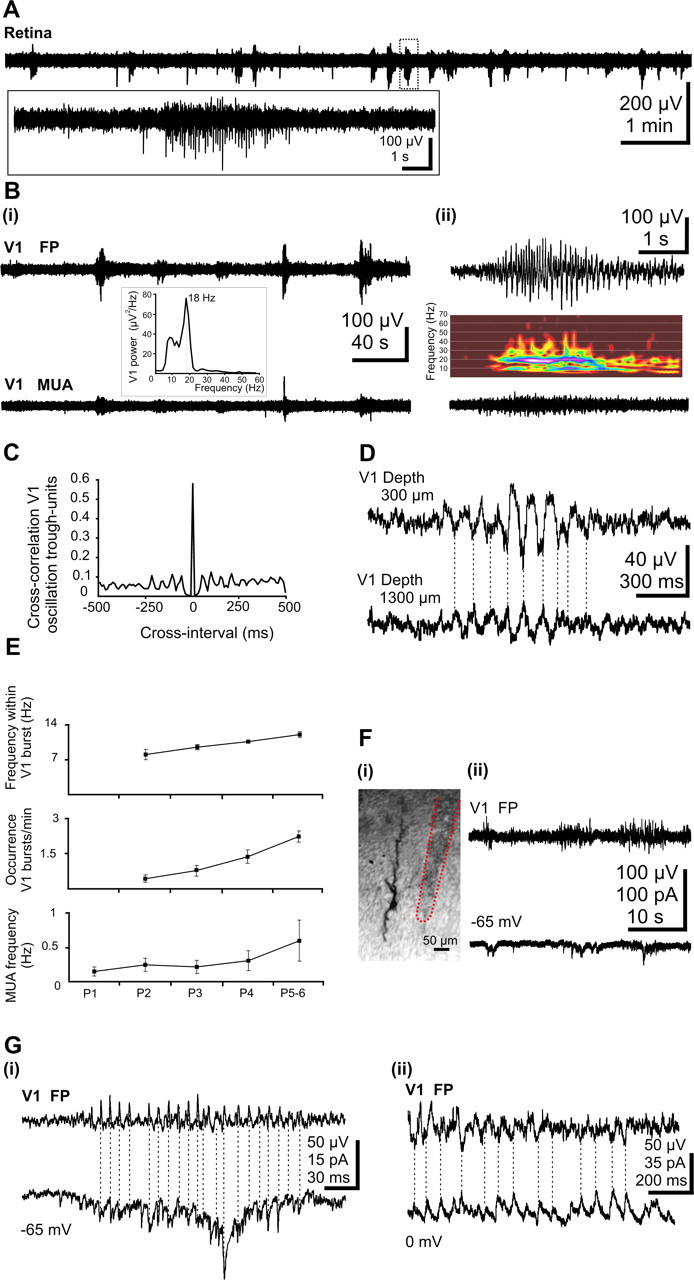
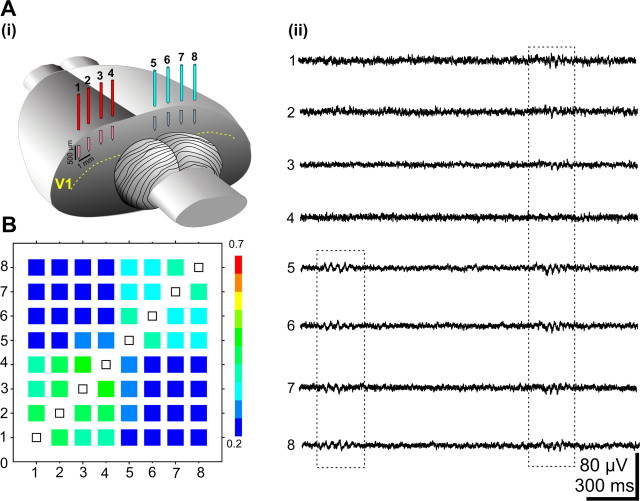
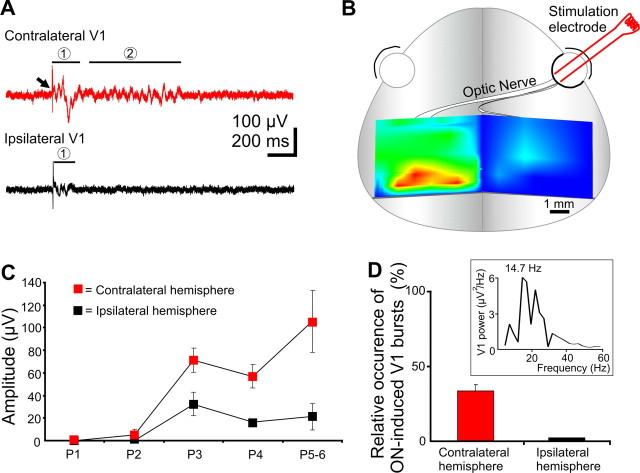
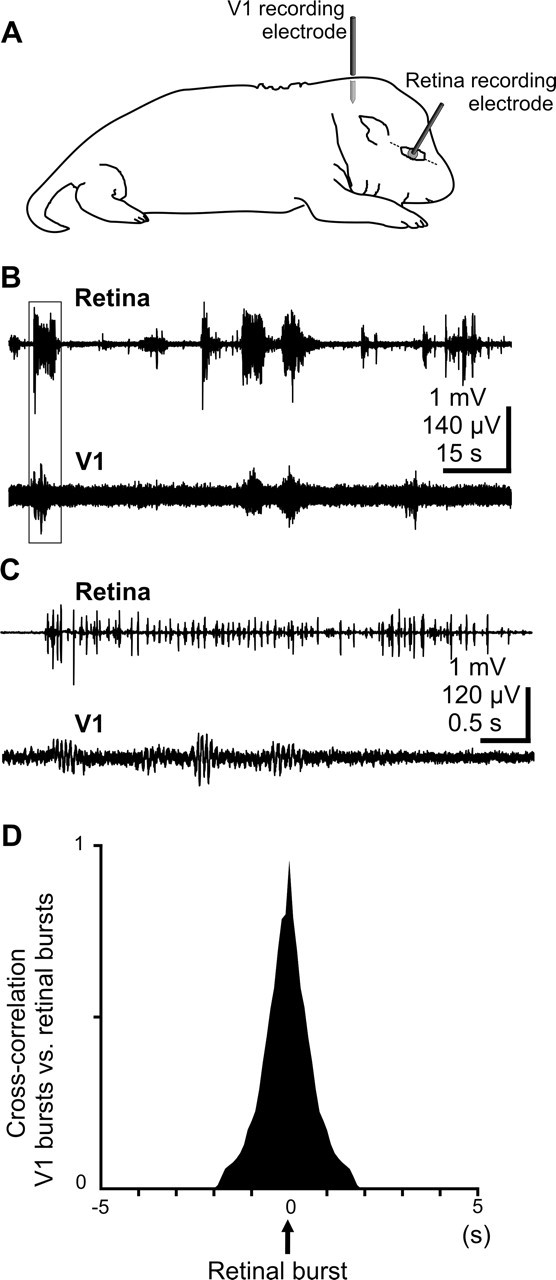
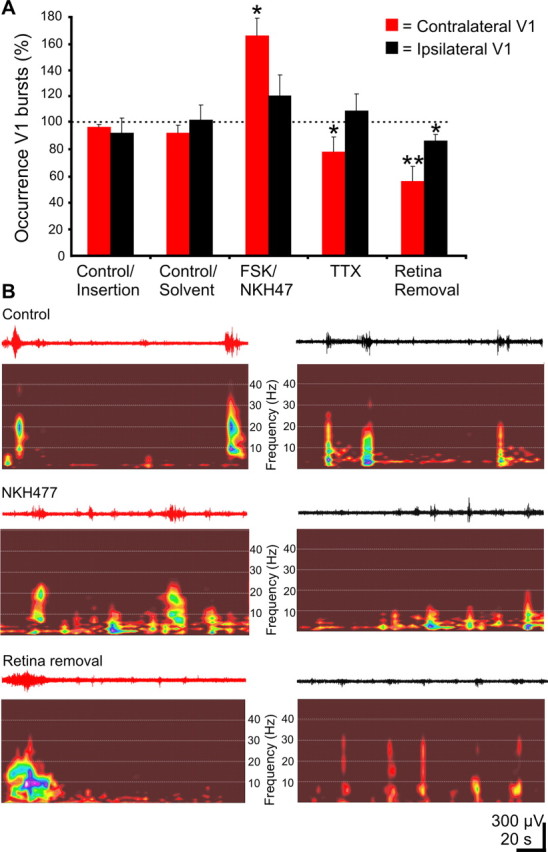
During visual system development, the light-insensitive retina spontaneously generates waves of activity, which are transmitted to the lateral geniculate nucleus. The crucial question is whether retinal waves are further transmitted to the cortex and influence the early cortical patterns of activity. Using simultaneous recordings from the rat retina and visual cortex during the first postnatal week in vivo, we found that spontaneous retinal bursts are correlated with spindle bursts (intermittent network bursts associated with spindle-shape field oscillations) in the contralateral visual cortex (V1). V1 spindle bursts could be evoked by electrical stimulation of the optic nerve. Intraocular injection of forskolin, which augments retinal waves, increased the occurrence of V1 spindle bursts. Blocking propagation of retinal activity, or removal of the retina reduced the frequency, but did not completely eliminate the cortical spindle bursts. These results indicate that spontaneous retinal waves are transmitted to the visual cortex and trigger endogenous spindle bursts. We propose that the interaction between retinal waves and spindle bursts contributes to the development of visual pathways to the cortex.


Figures

Figure 1.
Figure 1.
Burst activity in the retina and the V1 cortex of the newborn rat in vivo. A, Extracellular field potential recording from the retina of a P5 rat. Note the intermittent burst discharges separated by silent periods. Inset, Marked burst of action potentials is shown on expanded time scale. Bi, Wide-band recordings of extracellular field potential (top trace) and corresponding filtered (0.2 kHz) MUA (bottom trace) in V1 cortex of a P5 rat. Note the correlation between field activity and MUA. Inset, Averaged power spectrum of the field potential oscillations showing maximal power at 18 Hz. Bii, Spindle burst oscillation (top trace) and corresponding MUA (bottom trace) from the trace shown in Bi displayed at expanded time scale. Inset, Corresponding color-coded wavelet spectrum. C, Normalized cross-correlograms between V1 MUA and spindle troughs from the recording shown in B D, Transcortical wide-band recordings of field activity recorded in a P6 rat. Note the phase reversal and reduction of oscillation with increasing depth. E, Developmental profile of the spindle burst activity in V1 of newborn rat. Both the frequency of units (bottom diagram) as well as the occurrence of bursts (middle diagram) and the frequency within the spindle bursts (top diagram) significantly (p < 0.005) increased with age. Error bars indicate SEM. F, Synaptic correlates of V1 spindle bursts. Fi, Digital stack photomontage of a whole-cell recorded and biocytin-stained pyramidal neuron from a P5 rat. The trace of the extracellular electrode close to the cell is marked by a red dotted line. Fii, Extracellular field potential recording of V1 bursts (top trace) and simultaneous voltage-clamp whole-cell recording from a layer V pyramidal neuron at a holding potential of −65 mV (bottom trace). Gi, Phase-to-phase synchronization between V1 spindle bursts and glutamatergic EPSCs voltage-clamp recorded from a layer V neuron at a holding potential of −65 mV (the reversal potential of the GABAA receptor-mediated currents). Gii, Phase-to-phase synchronization between V1 spindle burstsand GABAergic PSCs recorded at 0 mV (the reversal potential for glutamatergic currents).
Figure 2.
Figure 2.
Spatial distribution of the spindle burst activity in V1. Ai, Illustration of the multielectrode array placed in the visual cortex. Aii, Extracellular field potential recordings performed from P6 V1 with an array of eight electrodes. Note the presence of spindle bursts synchronized over one as well as over both hemispheres. B, Averaged cross-correlation matrix of bursts recorded with eight electrodes. The cross-correlation coefficients were averaged for 5–7 bursts/electrode/pup and displayed as color-coded matrix. Note the high synchronization of bursts within one hemisphere. Data were pooled from 14 P5–P6 rats.
Figure 3.
Figure 3.
ON-driven activity in the V1 cortex of newborn rat. A, Extracellular recordings of the contralateral (top red trace) and ipsilateral (bottom black trace) cortical response to electrical stimulation of the ON in a P6 rat. Note the robust direct response (1) recorded in the contralateral hemisphere followed by spindle bursts (2), and the smaller direct response (1) on the ipsilateral side. B, Topographic localization of the visual cortex determined by ON responses. Multiple-site recordings were performed on both hemispheres and each direct ON-evoked response was normalized to the maximal response and color-coded (red, 100%; blue, 0%). C, Developmental profile of the contralateral and ipsilateral ON-evoked response. D, ON-induced oscillatory activity in the visual cortex. Bar diagram displaying the relative occurrence of ON-induced spindle bursts in the ipsilateral and contralateral V1 in five investigated rats. Inset, Power spectrum of averaged ON-induced oscillations in a P5 rat. Error bars indicate SEM.
Figure 4.
Figure 4.
Correlation between retinal bursts and V1 cortical spindle bursts. A, Scheme of experimental setup for simultaneous cortical and retinal recordings. B, Simultaneous extracellular local field potential recordings from retina and contralateral V1 in a P6 rat. C, Strongly correlated retinal burst and V1 spindle bursts from the traces shown in A and displayed at an expanded time scale. D, Cross-correlogram between the retinal bursts and V1 spindle bursts for four investigated pups.
Figure 5.
Figure 5.
Effect of modification of retinal waves on V1 spindle bursts. A, Bar diagram of the normalized frequency of contralateral (red bars) and ipsilateral (black bars) V1 spindle bursts under intraocular insertion of the needle and solvent injection after augmentation of the retinal waves [forskolin (FSK)/NKH477], after blockade of activity propagation (TTX), and after retina removal (n = 11 pups). Error bars indicate SEM. B, Extracellular recordings of the contralateral (red traces) and ipsilateral (black traces) V1 spindle bursts in a P5 rat and the corresponding color-coded wavelet spectra under control conditions after injection of NKH477 and after retina removal.

References

    1. Ben-Ari Y (2001). Developing networks play similar melody. Trends Neurosci 24:354–360. - PubMed
    1. Bourgeois JP, Rakic P (1996). Synaptogenesis in the occipital cortex of Macaque monkey devoid of retinal input from early embryonic stages. Eur J Neurosci 8:942–950. - PubMed
    1. Cang J, Renteria RC, Kaneko M, Liu X, Copenhagen DR, Stryker MP (2005). Development of precise maps in visual cortex requires patterned spontaneous activity in the retina. Neuron 48:797–809. - PMC - PubMed
    1. Chandrasekaran AR, Plas DT, Gonzalez E, Crair MC (2005). Evidence for an instructive role of retinal activity in retinotopic map refinement in the superior colliculus of the mouse. J Neurosci 25:6929–6938. - PMC - PubMed
    1. Chiu C, Weliky M (2001). Spontaneous activity in developing ferret visual cortex in vivo J Neurosci 21:8906–8914. - PMC - PubMed

Publication types

MeSH terms