

Vasotocin and mesotocin stimulate the biosynthesis of neurosteroids in the frog brain
- PMID: 16793882
- PMCID: PMC6673836
- DOI: 10.1523/JNEUROSCI.4469-05.2006
Vasotocin and mesotocin stimulate the biosynthesis of neurosteroids in the frog brain
Abstract
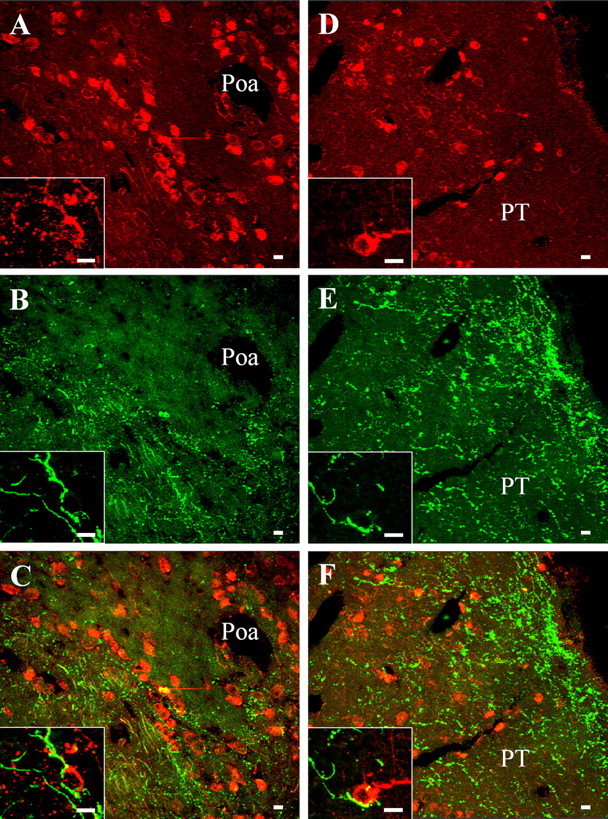
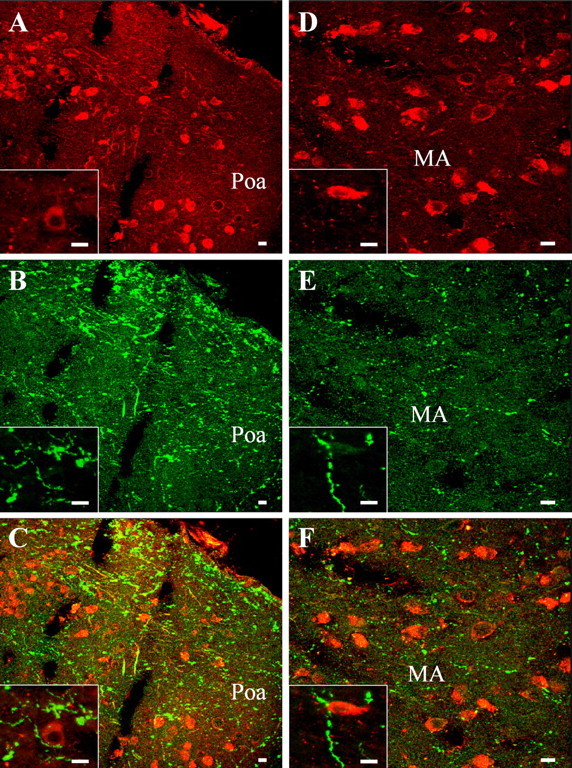
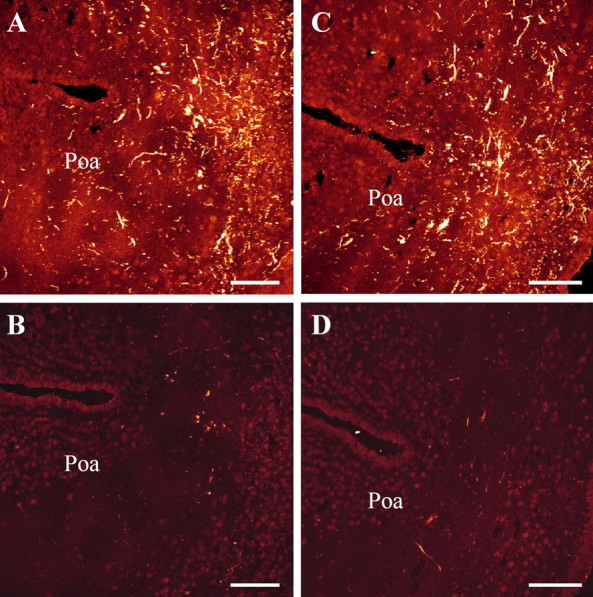
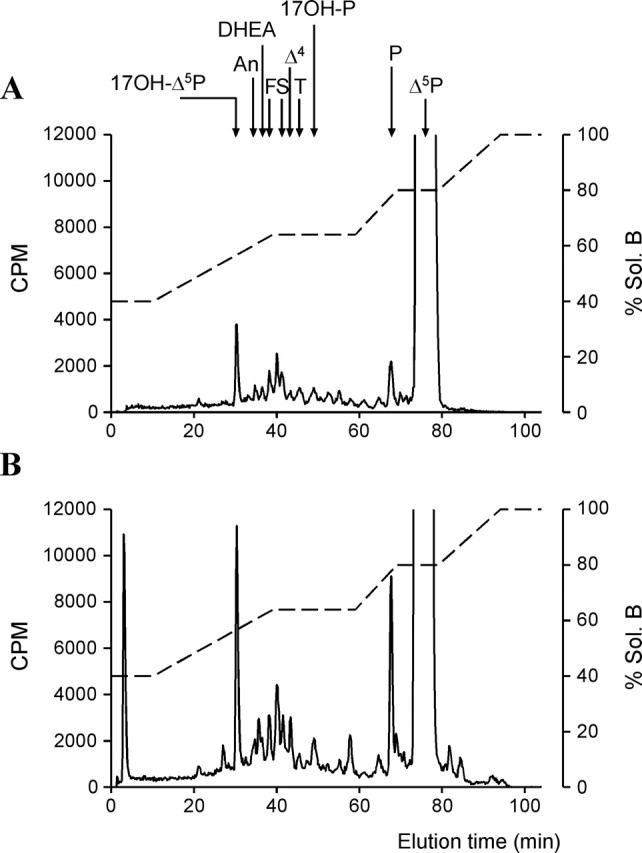
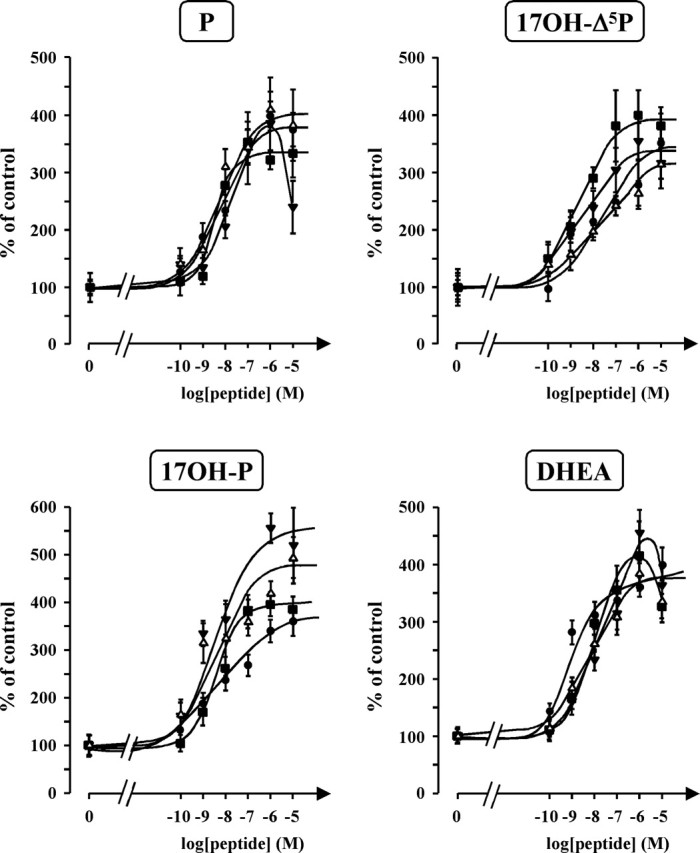
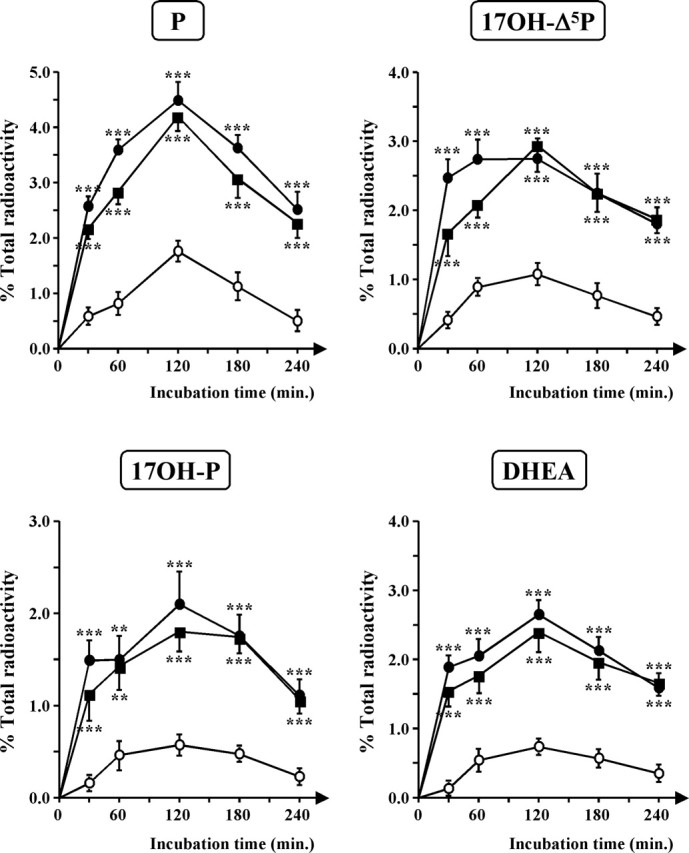
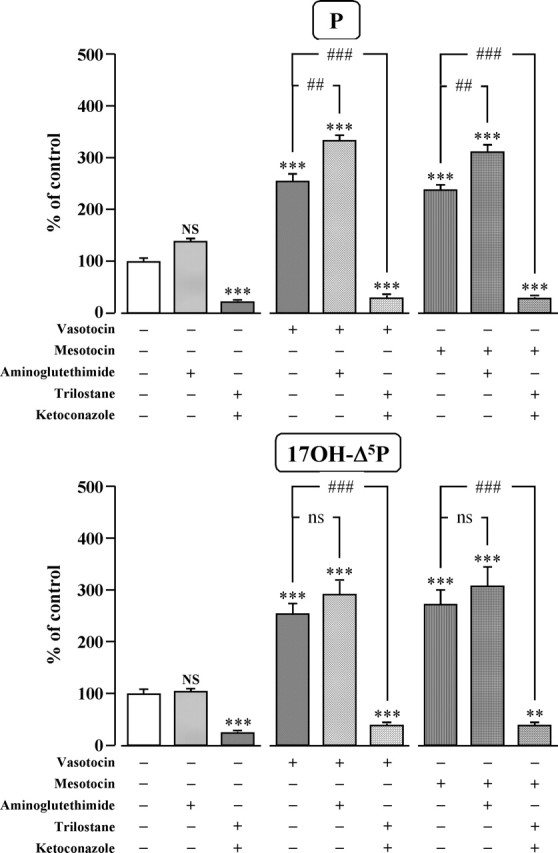
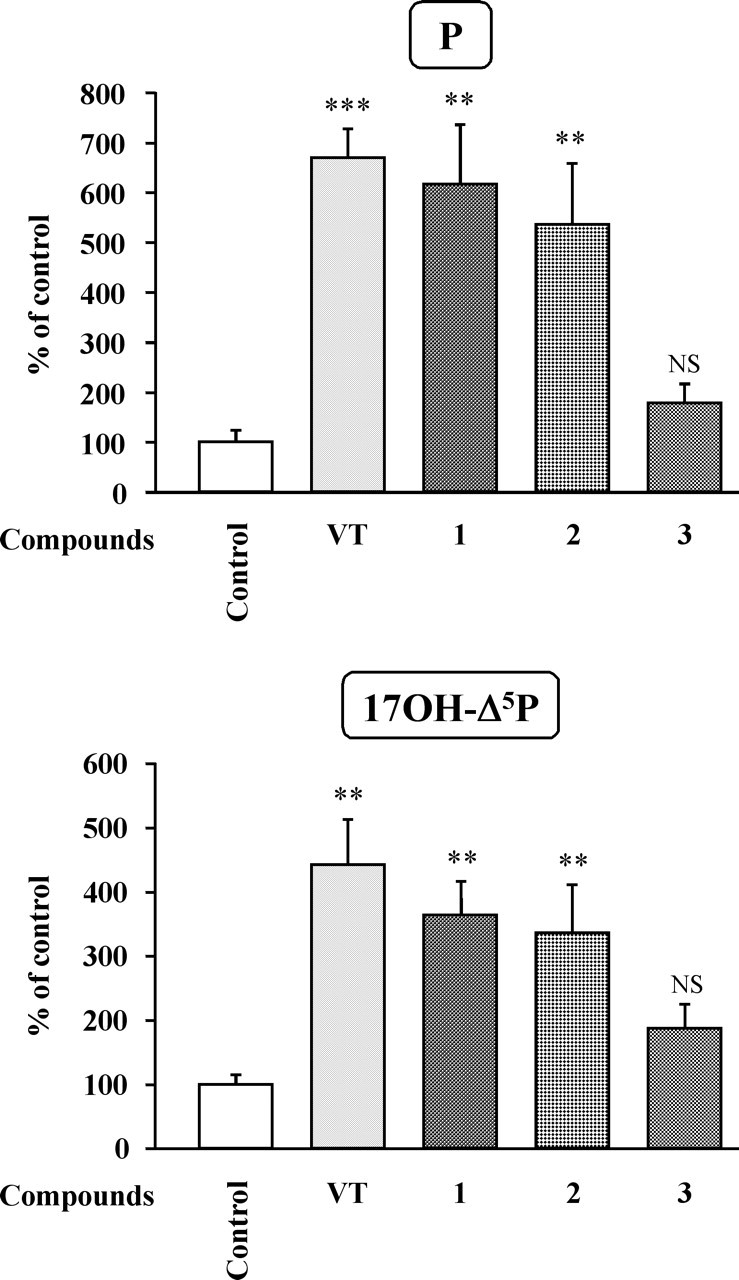
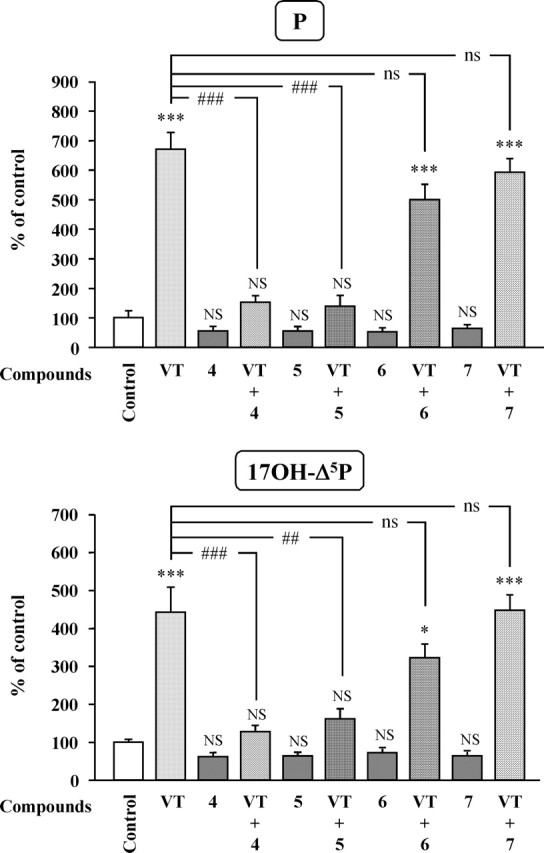
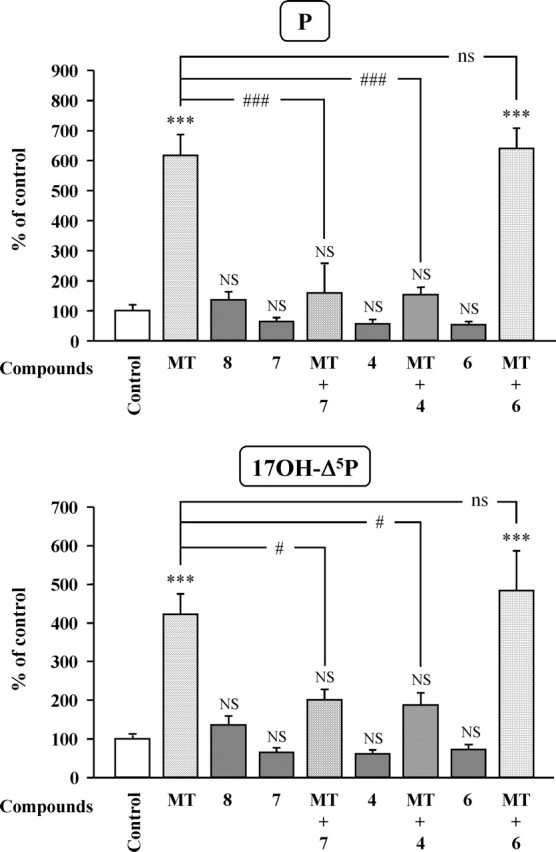
The neurohypophysial nonapeptides vasopressin (VP) and oxytocin (OT) modulate a broad range of cognitive and social activities. Notably, in amphibians, vasotocin (VT), the ortholog of mammalian VP, plays a crucial role in the control of sexual behaviors. Because several neurosteroids also regulate reproduction-related behaviors, we investigated the possible effect of VT and the OT ortholog mesotocin (MT) in the control of neurosteroid production. Double immunohistochemical labeling of frog brain sections revealed the presence of VT/MT-positive fibers in close proximity of neurons expressing the steroidogenic enzymes 3beta-hydroxysteroid dehydrogenase/delta5-delta4 isomerase (3beta-HSD) and cytochrome P450 17alpha-hydroxylase/c17, 20-lyase (P450(C17)). High concentrations of VT and MT receptor mRNAs were observed in diencephalic nuclei containing the 3beta-HSD and P450(C17) neuronal populations. Exposure of frog hypothalamic explants to graded concentrations of VT or MT produced a dose-dependent increase in the formation of progesterone, 17-hydroxypregnenolone, 17-hydroxyprogesterone, and dehydroepiandrosterone. The stimulatory effect of VT and MT on neurosteroid biosynthesis was mimicked by VP and OT, as well as by a selective V1b receptor agonist, whereas V2 and OT receptor agonists had no effect. VT-induced neurosteroid production was completely suppressed by selective V1a receptor antagonists and was not affected by V2 and OT receptor antagonists. Concurrently, the effect of MT on neurosteroidogenesis was markedly attenuated by selective OT and V1a receptor antagonists but not by a V2 antagonist. The present study provides the first evidence for a regulatory effect of VT and MT on neurosteroid biosynthesis. These data suggest that neurosteroids may mediate some of the behavioral actions of VT and MT.
Figures

Similar articles
-
Molecular cloning, pharmacological characterization, and histochemical distribution of frog vasotocin and mesotocin receptors.J Mol Endocrinol. 2004 Aug;33(1):293-313. doi: 10.1677/jme.0.0330293. J Mol Endocrinol. 2004. PMID: 15291760
-
gamma-Aminobutyric acid, acting through gamma -aminobutyric acid type A receptors, inhibits the biosynthesis of neurosteroids in the frog hypothalamus.Proc Natl Acad Sci U S A. 2000 Dec 5;97(25):13925-30. doi: 10.1073/pnas.240269897. Proc Natl Acad Sci U S A. 2000. PMID: 11087816 Free PMC article.
-
Oxytocin antagonist blocks the vasodepressor but not the vasopressor effect of neurohypophysial peptides in chickens.Peptides. 1994;15(8):1407-13. doi: 10.1016/0196-9781(94)90116-3. Peptides. 1994. PMID: 7700844
-
Neurosteroid biosynthesis in vertebrate brains.Comp Biochem Physiol C Pharmacol Toxicol Endocrinol. 1999 Oct;124(2):121-9. doi: 10.1016/s0742-8413(99)00065-1. Comp Biochem Physiol C Pharmacol Toxicol Endocrinol. 1999. PMID: 10622427 Review.
-
Examining the Role of Vasopressin in the Modulation of Parental and Sexual Behaviors.Front Psychiatry. 2015 Sep 22;6:130. doi: 10.3389/fpsyt.2015.00130. eCollection 2015. Front Psychiatry. 2015. PMID: 26441691 Free PMC article. Review.
Cited by
-
Birdsong and the neural production of steroids.J Chem Neuroanat. 2010 Mar;39(2):72-81. doi: 10.1016/j.jchemneu.2009.06.009. Epub 2009 Jul 7. J Chem Neuroanat. 2010. PMID: 19589382 Free PMC article. Review.
-
Social regulation of male reproductive plasticity in an African cichlid fish.Integr Comp Biol. 2013 Dec;53(6):938-50. doi: 10.1093/icb/ict017. Epub 2013 Apr 23. Integr Comp Biol. 2013. PMID: 23613320 Free PMC article. Review.
-
Do Dehydroepiandrosterone (DHEA) and Its Sulfate (DHEAS) Play a Role in the Stress Response in Domestic Animals?Front Vet Sci. 2020 Oct 26;7:588835. doi: 10.3389/fvets.2020.588835. eCollection 2020. Front Vet Sci. 2020. PMID: 33195624 Free PMC article. Review.
-
The brain of teleost fish, a source, and a target of sexual steroids.Front Neurosci. 2011 Dec 19;5:137. doi: 10.3389/fnins.2011.00137. eCollection 2011. Front Neurosci. 2011. PMID: 22194715 Free PMC article.
-
The non-benzodiazepine anxiolytic drug etifoxine causes a rapid, receptor-independent stimulation of neurosteroid biosynthesis.PLoS One. 2015 Mar 18;10(3):e0120473. doi: 10.1371/journal.pone.0120473. eCollection 2015. PLoS One. 2015. PMID: 25785994 Free PMC article.
References
-
- Acharjee S, Do Rego JL, Oh DY, Ahn RS, Lee K, Vaudry H, Kwon HB, Seong JY (2004). Molecular cloning, pharmacological characterization, and histochemical distribution of frog vasotocin and mesotocin receptors. J Mol Endocrinol 33:293–313. - PubMed
-
- Akwa Y, Young J, Kabbadj K, Sancho MJ, Zucman D, Vourc’h C, Jung-Testas I, Hu ZY, Le Goascogne C, Jo DH, Corpéchot C, Simon P, Baulieu EE, Robel P (1991). Neurosteroids: biosynthesis, metabolism and function of pregnenolone and dehydroepiandrosterone in the brain. J Steroid Biochem Mol Biol 40:71–81. - PubMed
-
- Argiolas A, Gessa GL (1991). Central functions of oxytocin. Neurosci Biobehav Rev 15:217–231. - PubMed
-
- Balthazart J, Absil P, Viglietti-Panzica C, Panzica GC (1997). Vasotocinergic innervation of areas containing aromatase-immunoreactive cells in the quail forebrain. J Neurobiol 33:45–60. - PubMed
-
- Balthazart J, Baillien M, Ball GF (2002). Interactions between aromatase (estrogen synthase) and dopamine in the control of male sexual behavior in quail. Comp Biochem Physiol 132:37–55. - PubMed
Publication types
MeSH terms
Substances
LinkOut - more resources
Full Text Sources