Comparative Study
. 2006 Jun 21;26(25):6781-90.
doi: 10.1523/JNEUROSCI.0514-06.2006.

Glial progenitors in adult white matter are driven to form malignant gliomas by platelet-derived growth factor-expressing retroviruses

Affiliations
Comparative Study

Glial progenitors in adult white matter are driven to form malignant gliomas by platelet-derived growth factor-expressing retroviruses

Marcela Assanah et al. J Neurosci. .

Abstract

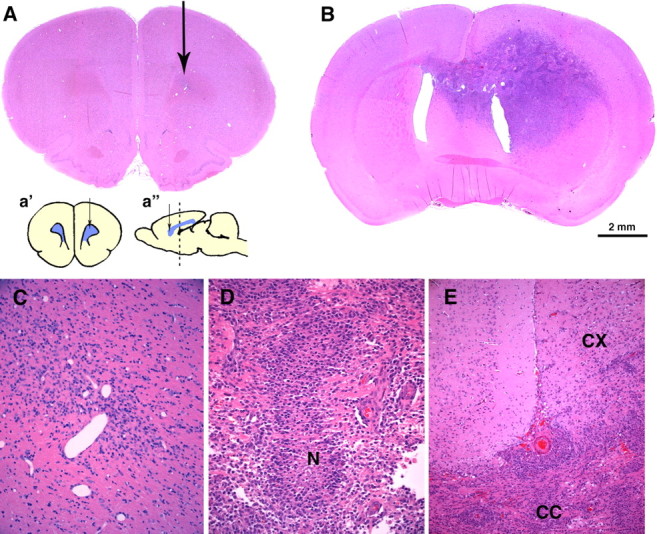
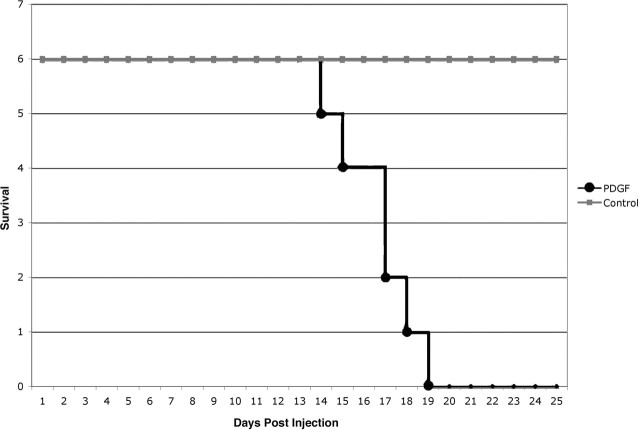
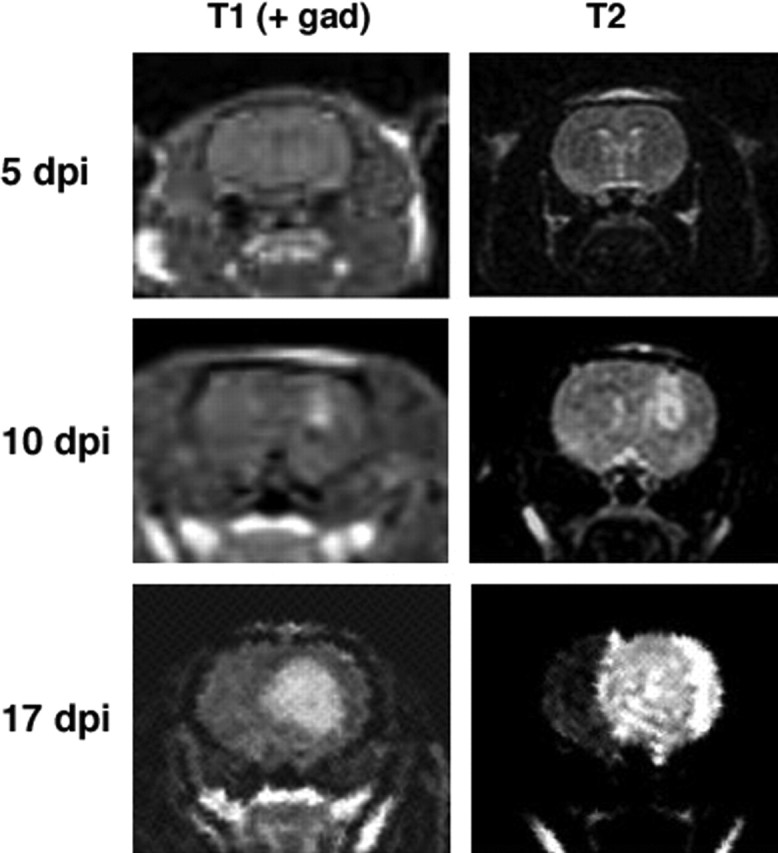
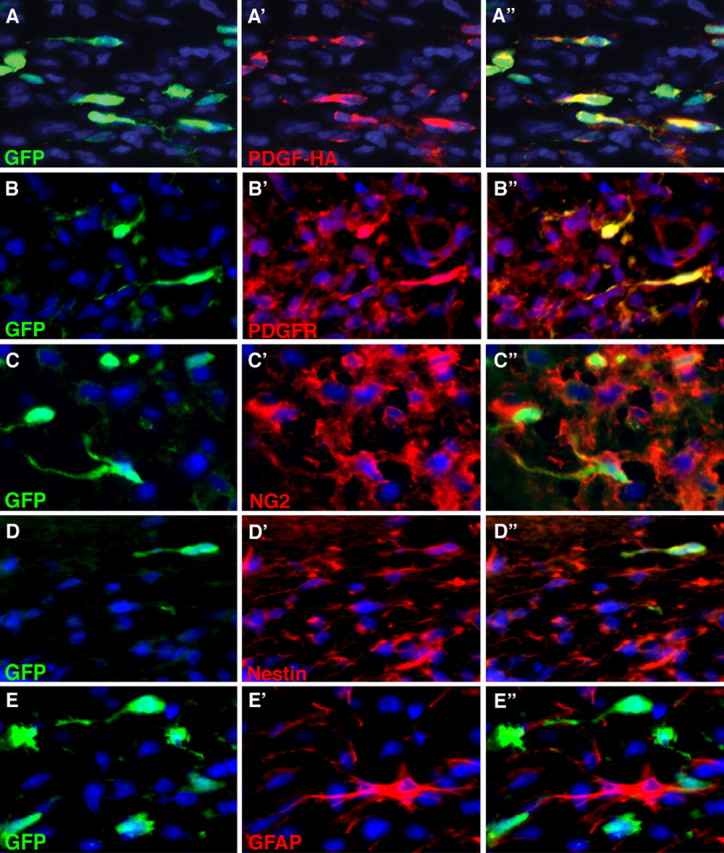
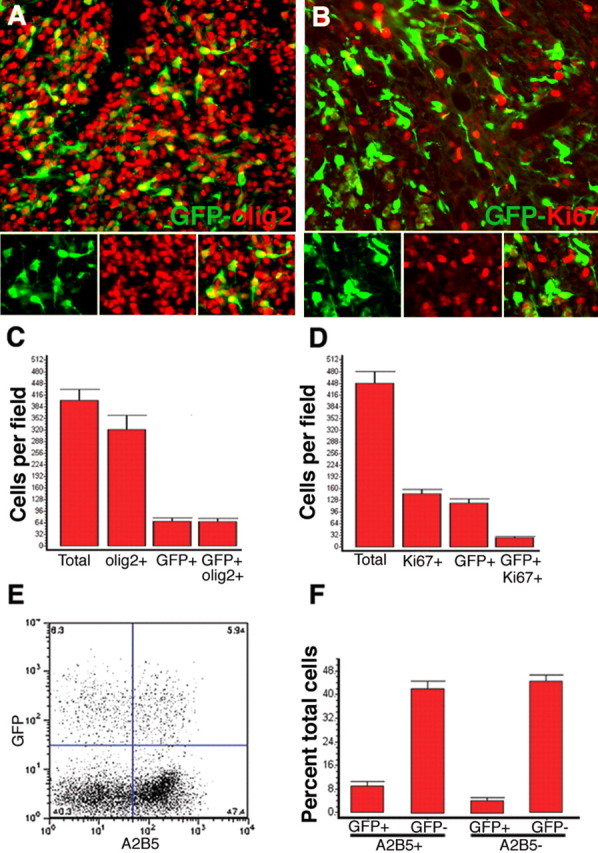
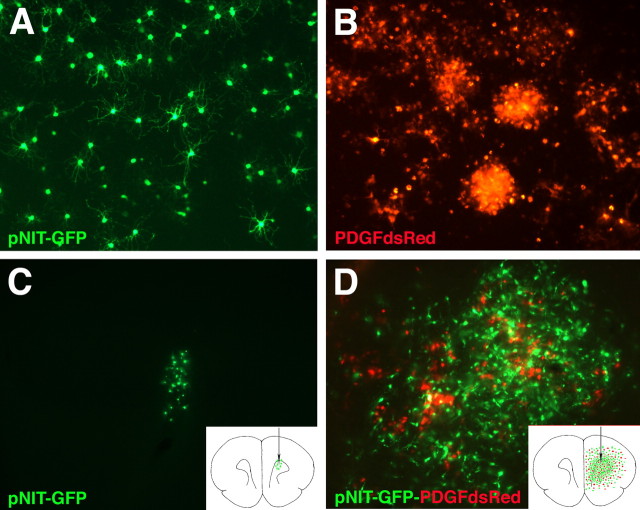
To test the gliomagenic potential of adult glial progenitors, we infected adult rat white matter with a retrovirus that expresses high levels of PDGF and green fluorescent protein (GFP). Tumors that closely resembled human glioblastomas formed in 100% of the animals by 14 d postinfection. Surprisingly, the tumors were composed of a heterogeneous population of cells, <20% of which expressed the retroviral reporter gene (GFP). The vast majority of both GFP+ and GFP- tumor cells expressed markers of glial progenitors. Thus, the tumors arose from the massive expansion of both infected and uninfected glial progenitors, suggesting that PDGF was driving tumor formation via autocrine and paracrine stimulation of glial progenitor cells. To explore this possibility further, we coinjected a retrovirus expressing PDGF-IRES-DsRed with a control retrovirus expressing only GFP. The resulting tumors contained a mixture of red cells (PDGF-expressing/tumor-initiating cells) and green cells (recruited progenitors). Both populations were highly proliferative and infiltrative. In contrast, when the control GFP retrovirus was injected alone, the animals never formed tumors and the majority of infected cells differentiated along the oligodendrocyte lineage. Together, these results reveal that adult white matter progenitors not only have the capacity to give rise to gliomas, but resident progenitors are recruited to proliferate within the mitogenic environment of the tumor and in this way contribute significantly to the heterogeneous mass of cells that compose a malignant glioma.


Figures

Figure 1.
Figure 1.
PDGF overexpression induces the formation of malignant gliomas. Hematoxylin and eosin stains were performed on coronal sections of adult rat brains 14 dpi with pQ-GFP (A, C) or PDGF-IRES-GFP (B, D, E). A, No tumors formed in brains injected with the control retrovirus, but a small area of reactive gliosis is seen around the needle track (arrow). C, Higher-magnification micrograph showing the injection site. B, Large infiltrative tumors with the histological features of human glioblastoma formed by 14 dpi with PDGF-IRES-GFP retrovirus. This section, 3 mm caudal from injection site, shows the tumor extending across the corpus callosum into the contralateral hemisphere. D, Higher-magnification micrograph showing an area of pseudopalisading necrosis (N), a hallmark of glioma malignancy seen in human glioblastomas. E, Tumor cells crossing the corpus callosum (CC) and infiltrating the cortex (CX). Scale bar: (in B) A, B, 2 mm. Insets in A are coronal (a′) and sagittal (a″) schematic diagrams of the injection site (arrow) at the level of the forceps minor corpus callosum. The dotted line in a″ shows the level of the coronal section shown in B.
Figure 2.
Figure 2.
PDGF retrovirus causes rapid tumor formation and morbidity. Kaplan–Meier survival curve showing the rapid onset of tumor-induced morbidity. Equal volumes and titers of pQ-GFP or PDGF-IRES-GFP were injected into the subcortical white matter of adult rats (6 rats in each group). All rats injected with the PDGF-IRES-GFP retrovirus showed signs of tumor-induced morbidity between 14 and 19 dpi. None of the rats injected with pQ-GFP showed any signs of tumor-induced morbidity at 35 dpi. The graph shows the results of one representative experiment. In total, we have performed survival studies on 32 rats injected with the PDGF-IRES-GFP retrovirus. All have developed tumor-induced morbidity between 14 and 20 dpi. In all cases, the presence of a malignant glioma was confirmed by histologic analysis.
Figure 3.
Figure 3.
Serial MRI studies show tumor progression. MRI scans were performed on adult rats at 5, 10, and, 17 dpi with the PDGF-IRES-GFP retrovirus. Here, we show a representative series of coronal images from one animal. No tumor is visible at 5 dpi. By 10 dpi, a small tumor is seen at the injection site on postcontrast T1 images. Tumor-induced edema is visible on T2 images. At 17 dpi, a large tumor is visible on postcontrast T1 image, and edema involves the entire hemisphere and part of the contralateral hemisphere as seen in the T2 image. gad, Gadolinium.
Figure 4.
Figure 4.
GFP expression reveals the distribution of retrovirally infected cells. Immunofluorescence analysis for GFP and SMA was performed on sections of tumor at 17 dpi with the PDGF-IRES-GFP retrovirus. A, Micrograph shows GFP+ cells (green) crossing the corpus callosum (CC) and invading the contralateral hemisphere. Hoechst stain (blue) shows increased cellular density in and around the main tumor mass. Note that only a subset of the cells is GFP+. B, GFP+ and GFP− cells are seen intermingled throughout the tumor, including in areas of pseudopalisading necrosis (N). C, SMA immunofluorescence (red) shows marked vascular proliferation with recruitment of perivascular smooth muscle cells. Scale bar, 1 mm.
Figure 5.
Figure 5.
GFP+ and GFP− tumor cells express markers of glial progenitor cells. Double-immunofluorescence analysis of tumors, 17 dpi with the PDGF-IRES-GFP retrovirus, shows that GFP (green) is expressed in only a subset of tumor cells. A–A″, PDGF-HA expression (red) is seen in the same subset of cells that express GFP. However, PDGFRα (B′, B″), NG2 (C′, C″), and nestin (D′, D″), each stained red, are expressed in the vast majority of GFP+ and GFP− tumor cells. E′, E″, GFAP+/GFP− reactive astrocytes (red) are seen scattered throughout the tumor. Rare GFAP+/GFP+ cells were seen (<3%).
Figure 6.
Figure 6.
Quantitative analysis shows that the majority of cells in the PDGF-driven tumors are GFP− progenitor cells. A, Double immunofluorescence of tumors, 17 dpi with PDGF-IRES-GFP, shows that the vast majority of tumor cells are olig2+ (red), but only a subset of olig2+ cells are GFP+ (green). B, Double immunofluorescence for GFP (green) and Ki67 (red), a marker for cycling cells, shows that tumor cells are highly proliferative, but only a subset of Ki67+ cells are GFP+. The triptych at the bottom of A and B show green, red, and green/red overlay. C, Bar graph showing the number of total cells (identified by Hoechst nuclear staining), olig2+, GFP+, and GFP+/olig2+, cells per high-powered field. D, Bar graph showing the number of total, Ki67+, GFP+, and GFP+/Ki67+ cells per high-powered field. Data represent the mean ± SEM of multiple high-powered fields from three separate brain tumors. E, F, Cells isolated from freshly dissected tumors (17 dpi with PDGF-IRES-GFP retrovirus) were immunostained with the progenitor cell marker A2B5 and analyzed by flow cytometry. E, Scatter plot from a single representative experiment showing the relative abundance of four populations of tumor cells: GFP+/A2B5+, GFP−/A2B5+, GFP+/A2B5−, and GFP/A2B5−. F, Bar graph showing the percentage of cells in each population. Data represent the mean ± SEM from three separate experiments.
Figure 7.
Figure 7.
Coinjection studies show that PDGF-expressing cells recruit other progenitors to proliferate within the tumor. A, Low-power micrograph showing a small collection of GFP+ cells (green) along the injection track (white arrow) at 17 dpi with pNIT-GFP. B, In contrast, a large tumor containing many GFP+ cells (green) and DsRed+ cells (red) are seen at 17 dpi with pNIT-GFP and PDGF-IRES-DsRed. Note that this section, 3 mm caudal of the injection site, shows that many of the GFP+ cells are seen crossing the corpus callosum (CC) into the contralateral hemisphere. Scale bars: A, B, 2 mm: A, B, C, Higher-magnification micrograph showing red and green cells intermingled throughout the tumor, including areas of pseudopalisading necrosis (N). D, Cells isolated from tumors (17–19 dpi with pNIT-GFP and PDGF-IRES-DsRed) were FACS-sorted into four populations: GFP−/DsRed−, GFP+/DsRed−, DsRed+/GFP−, and DsRed+/GFP+. Totals of 1.5 × 10⁶ GFP+/DsRed− cells and 2.8 × 10⁵ DsRed+/GFP− cells were sorted from two pooled tumors in this representative experiment (the experiment was repeated five times). E–E″, In brains injected with pNIT-GFP (17 dpi), the GFP+ cells have a highly branched morphology and are negative for the proliferation marker Ki67 (labeling index of <5%). F–F″, In tumors generated by coinfection of pNIT-GFP and PDGF-IRES-DsRed, the GFP+ cells have an immature morphology and many are Ki67+ (labeling index of 26%). Insets in A and B are schematic diagrams illustrating the distribution and number of cells (green and red dots) in coronal sections of adult brain at their corresponding levels.
Figure 8.
Figure 8.
Adult white matter progenitors infected with PDGF-IRES-DsRed in vitro form malignant gliomas through autocrine and paracrine signaling. Normal adult white matter progenitors were isolated and expanded for 5 d in vitro with B104-containing media. Proliferating progenitors were then infected with pNIT-GFP or PDGF-IRES-DsRed. A, B, Adult white matter progenitors grown in culture for 10 dpi in basal media. A, pNIT-GFP-infected cells stopped proliferating and acquired a highly branched morphology. B, PDGF-IRES-DsRed-infected cells retained a simple morphology and remained highly proliferative, forming large clusters of cells. C, D, At 2 d postinfection, the cells were implanted into adult brains. Brains were analyzed at 20 dpi. C, pNIT-GFP-infected cells injected alone remained close to the injection site and no tumors formed. D, When pNIT-GFP-infected cells were coinjected with PDGF-IRES-DsRed-infected cells, a tumor formed by 20 dpi, and this tumor is composed of a mixture of red and green cells. Equal numbers of pNIT-GFP cells were injected in C and D. Note the marked proliferation and dispersion of pNIT-GFP cells in the presence of PDGF-IRES-DsRed cells (D). Insets in C and D are schematic diagrams illustrating the distribution and number of cells (green and red dots) in coronal sections of adult brain at the level of the injection site.

Similar articles

Cited by

References

    1. Bachoo RM, Maher EA, Ligon KL, Sharpless NE, Chan SS, You MJ, Tang Y, DeFrances J, Stover E, Weissleder R, Rowitch DH, Louis DN, DePinho RA (2002). Epidermal growth factor receptor and Ink4a/Arf: convergent mechanisms governing terminal differentiation and transformation along the neural stem cell to astrocyte axis. Cancer Cell 1:269–277. - PubMed
    1. Berkman RA, Clark WC, Saxena A, Robertson JT, Oldfield EH, Ali IU (1992). Clonal composition of glioblastoma multiforme. J Neurosurg 77:432–437. - PubMed
    1. Betsholtz C, Johnsson A, Heldin CH, Westermark B (1986). Efficient reversion of simian sarcoma virus-transformation and inhibition of growth factor-induced mitogenesis by suramin. Proc Natl Acad Sci USA 83:6440–6444. - PMC - PubMed
    1. Blankenberg FG, Teplitz RL, Ellis W, Salamat MS, Min BH, Hall L, Boothroyd DB, Johnstone IM, Enzmann DR (1995). The influence of volumetric tumor doubling time, DNA ploidy, and histologic grade on the survival of patients with intracranial astrocytomas. AJNR Am J Neuroradiol 16:1001–1012. - PMC - PubMed
    1. Bogler O, Wren D, Barnett SC, Land H, Noble M (1990). Cooperation between two growth factors promotes extended self-renewal and inhibits differentiation of oligodendrocyte-type-2 astrocyte (O-2A) progenitor cells. Proc Natl Acad Sci USA 87:6368–6372. - PMC - PubMed

Publication types

MeSH terms