Comparative Study
. 2006 Jun 21;26(25):6791-802.
doi: 10.1523/JNEUROSCI.5435-05.2006.

Linking neural representation to function in stereoscopic depth perception: roles of the middle temporal area in coarse versus fine disparity discrimination

Affiliations
Comparative Study

Linking neural representation to function in stereoscopic depth perception: roles of the middle temporal area in coarse versus fine disparity discrimination

Takanori Uka et al. J Neurosci. .

Abstract

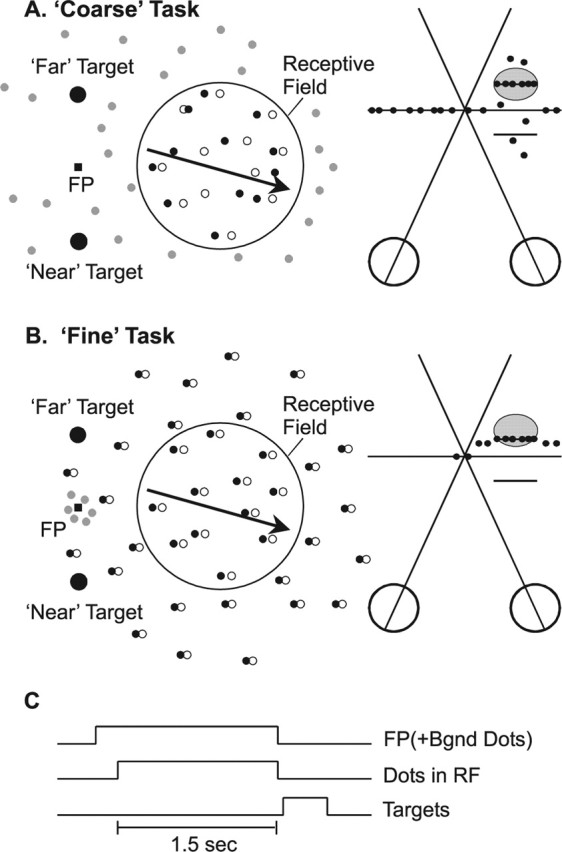
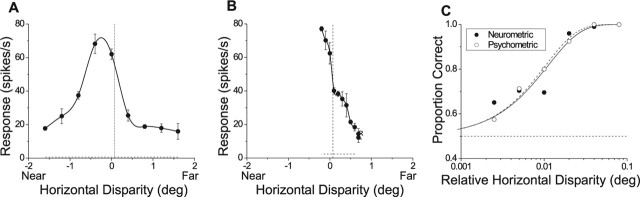
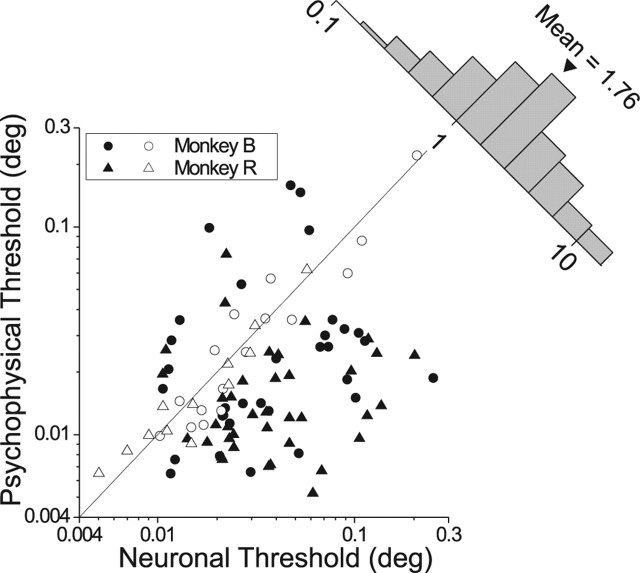
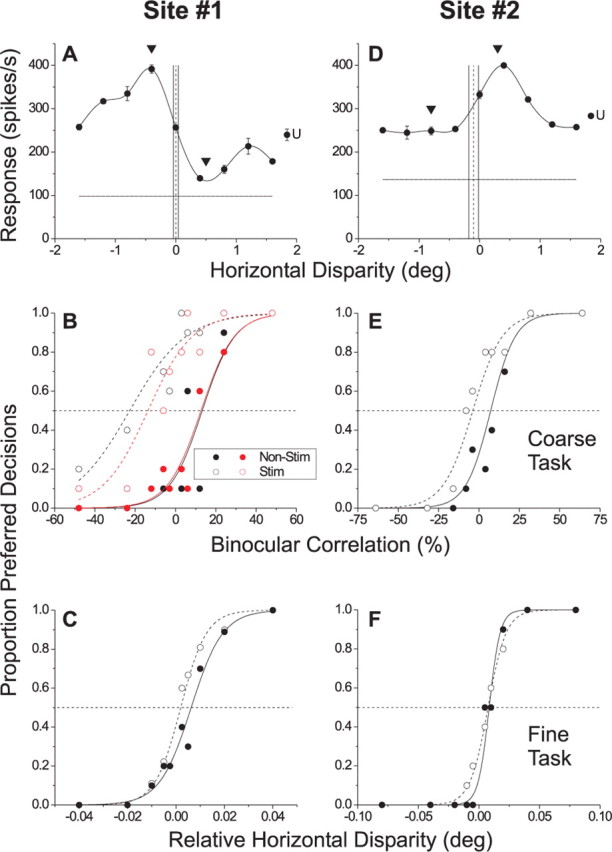
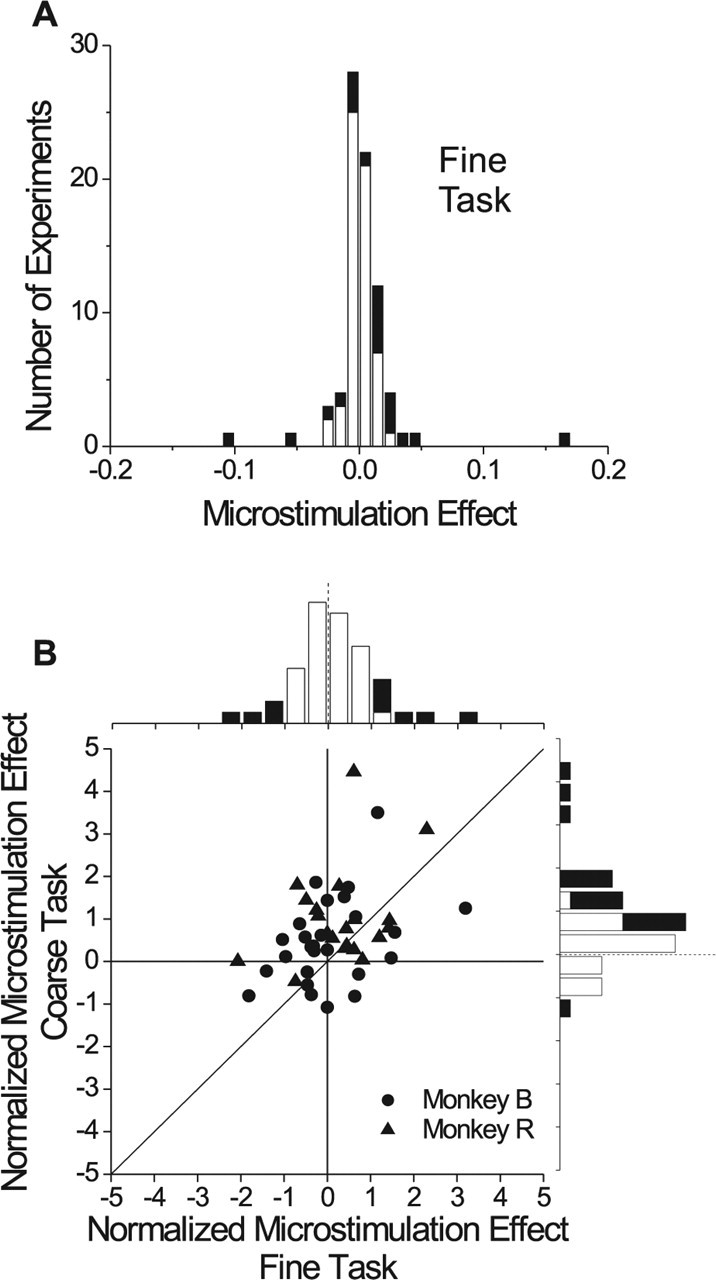
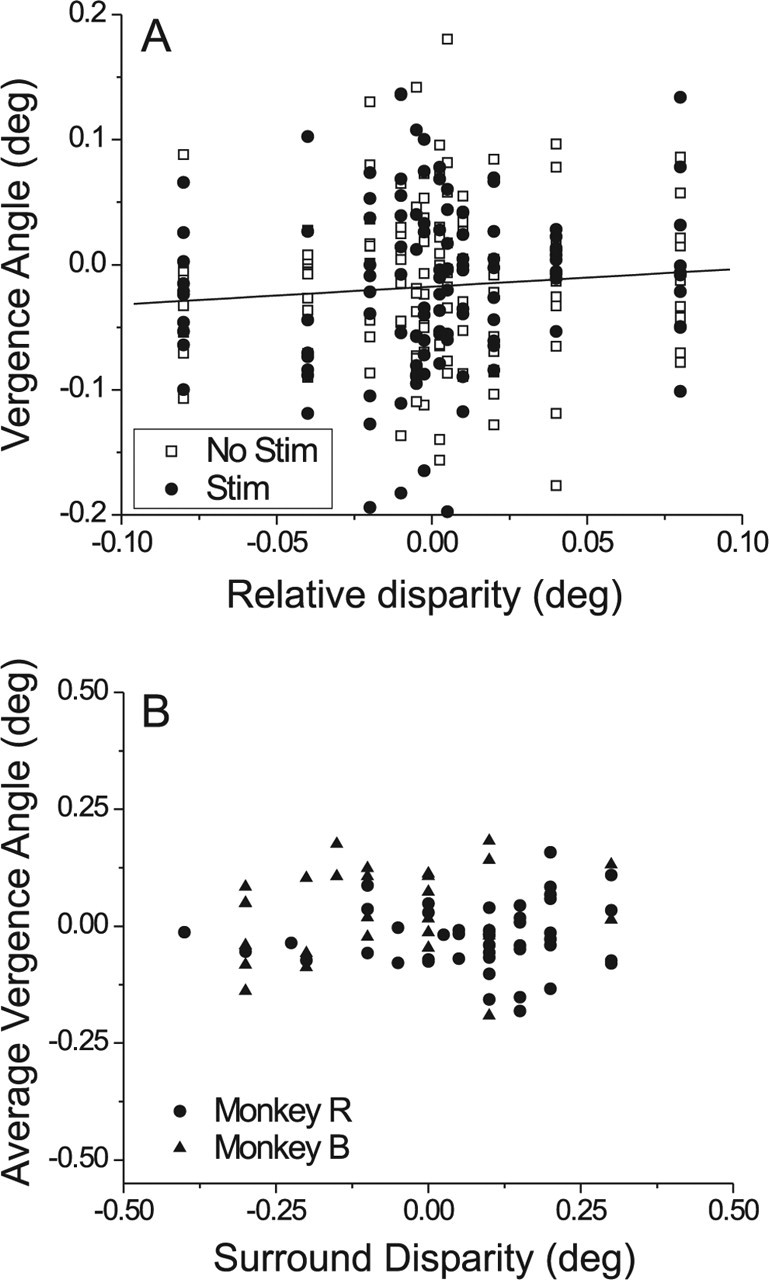
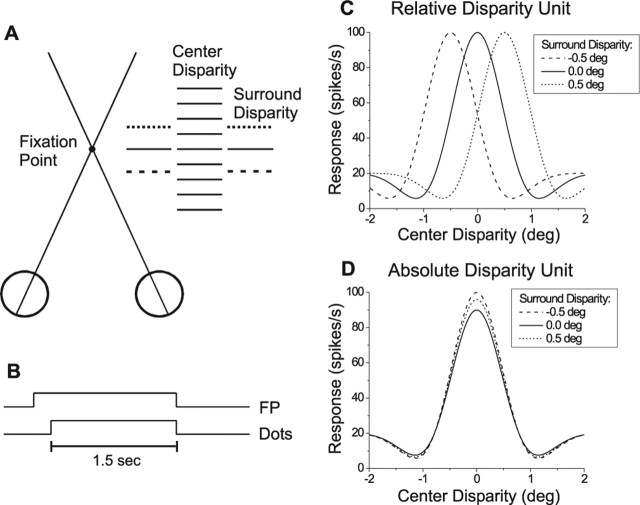
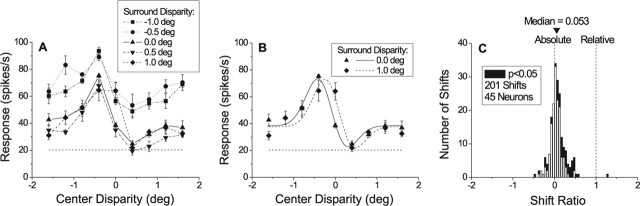
Neurons selective for binocular disparity form the neural substrate for stereoscopic depth perception and are found in several areas of primate visual cortex. Presumably, multiple representations of disparity exist to serve different functions, but the specific contributions of different visual areas to depth perception remain poorly understood. We examine this issue by comparing the contributions of the middle temporal (MT) area to performance of two depth discrimination tasks: a "coarse" task that involves discrimination between absolute disparities in the presence of noise, and a "fine" task that involves discrimination of very small differences in relative disparity between two stimuli in the absence of noise. In the fine task, we find that electrical microstimulation of MT does not affect perceptual decisions, although many individual MT neurons have sufficient sensitivity to account for behavioral performance. In contrast, microstimulation at the same recording sites does bias depth percepts in the coarse task. We hypothesized that these results may be explained by the fact that MT neurons do not represent relative disparity signals that are thought to be essential for the fine task. This hypothesis was supported by single-unit recordings that show that MT neurons signal absolute, but not relative, disparities in a stimulus configuration similar to that used in the fine task. This work establishes a link between the neural representation of disparity in MT and the functional contributions of this area to depth perception.


Figures

Figure 1.
Figure 1.
Schematic illustration of the two depth-discrimination tasks. A, The coarse task. A random-dot stereogram was presented within a circular aperture over the receptive field (RF), and dots moved at the preferred velocity of the neuron (arrow). Filled and open dots represent left and right half images, respectively. The background was filled with dynamic zero-disparity dots (gray). Saccade targets were located 5° above and below the fixation point, corresponding to far and near choices, respectively. The strength of the depth signal was adjusted by varying binocular correlation. At 50% binocular correlation (right), half of the dots within the receptive field were presented at either the preferred disparity of the neuron (horizontal line inside gray oval) or the disparity that elicited a minimal response (null disparity). The remaining dots had random disparities. B, The fine task. A bipartite (center/surround) random-dot stereogram was presented. The center patch covered the RF, and contained dots moving at the preferred velocity (arrow). The surrounding annulus contained stationary dots presented (in most cases) at a nonzero disparity. A small patch of zero-disparity dots (gray) surrounded the fixation point to help anchor vergence. The monkey reported whether the center patch was in front of or behind the surround patch, and task difficulty was manipulated by finely varying the center disparity around the surround disparity. C, Trial timing. The fixation point (FP) first appeared, along with the zero-disparity background (Bgnd) dots. After a 1.5 s stimulus presentation, the fixation point and dots were extinguished, and two choice targets appeared. Monkeys reported depth by making a saccade to one of the two targets.
Figure 2.
Figure 2.
Example single-unit data. A, Disparity-tuning curve for a near-tuned neuron from monkey B. Filled circles show mean responses (±SE) to five repetitions of each disparity. The solid curve is a spline fit. The vertical dotted line denotes the disparity of the surround patch (0.075°), which was placed at the steepest slope of the tuning curve. B, Disparity-tuning curve of the same neuron using a narrower range of disparities. C, Neurometric (filled circles) and psychometric (open circles) functions obtained during performance of the fine task. Solid and dashed curves show Weibull fits to the neurometric and psychometric functions, respectively.
Figure 3.
Figure 3.
Population summary of neuronal and psychophysical thresholds for the fine task. Data are shown for 98 MT neurons (50 from monkey B and 48 from monkey R). Filled symbols indicate cases in which the neuronal and psychophysical thresholds are significantly different (p < 0.05). Circles and triangles indicate data from monkeys B and R, respectively. The histogram (upper right) shows the distribution of neuronal to psychophysical threshold ratios.
Figure 4.
Figure 4.
Example effects of MT microstimulation on the two depth-discrimination tasks. Each column shows data for a different stimulation site. A, Disparity-tuning curve of MU activity recorded at a near-tuned site (site 1). Arrowheads denote the preferred (−0.4°) and null (0.5°) disparities used in the coarse task. The dashed vertical line indicates the disparity of the surround patch (0.0°) and the solid vertical lines indicate the range of center disparities used in the fine task. The horizontal line shows the spontaneous activity level. The point labeled “U” denotes the mean response to binocularly uncorrelated dots. B, Effect of microstimulation of site 1 on performance of the coarse task. Filled circles and the solid line represent the psychometric function for nonstimulated trials, whereas open circles and the dashed line show data from stimulated trials. Black symbols show data from the first block of absolute disparity trials. Red symbols show data from a repeat experiment that was performed after an intervening block of relative disparity trials. The horizontal dashed line denotes chance performance. C, Effect of microstimulation of site 1 on performance of the fine task. D, Disparity-tuning curve of multiunit activity recorded at a far-tuned stimulation site (site 2). E, Effect of microstimulation of site 2 on performance of the coarse task. F, Effect of microstimulation of site 2 on performance of the fine task. Error bars indicate SE.
Figure 5.
Figure 5.
Population summary of microstimulation effects. A, Data are shown for 78 sessions of the fine task. This distribution shows the shift between stimulated and nonstimulated psychometric functions in degrees of visual angle. Black bars denote stimulation effects that were statistically significant (logistic regression, p < 0.05). B, Effects of microstimulation for 46 experiments in which both the coarse and fine tasks were performed in separate blocks. Microstimulation effects are normalized to the slope of the psychometric function (see Materials and Methods) to make the data comparable. Frequency histograms for the two tasks are shown along the top and right margins. Filled bars indicate significant effects (logistic regression, p < 0.05).
Figure 6.
Figure 6.
Analysis of vergence eye movements during microstimulation in the fine task. A, Vergence data from an example experiment. The time-averaged vergence angle for each trial is plotted against the relative disparity between center and surround stimuli. Filled circles indicate trials during which microstimulation was delivered; open squares correspond to trials without microstimulation. B, The average vergence angle (across all trials and all center disparities) of the monkey is plotted as a function of the disparity of the surrounding annulus. Each datum represents one experiment, with circles and triangles denoting data from monkeys R and B, respectively.
Figure 7.
Figure 7.
Schematic illustration of stimuli and predicted outcomes for tests of absolute versus relative disparity tuning. A, Top-down view of the stimulus configuration, consisting of a center patch of dots and a surrounding annulus. All combinations of nine center disparities and three to five surround disparities were presented in randomly interleaved trials. B, The bipartite stereogram was presented for 1.5 s during fixation. C, If a neuron signals relative disparity, the disparity tuning in response to the center patch should shift horizontally by an amount equal to the change in surround disparity. D, If a neuron signals absolute disparity, no shifts should be seen although amplitude variations may occur.
Figure 8.
Figure 8.
MT neurons signal absolute, not relative, disparities. A, Disparity-tuning curves for an example neuron are plotted for five different surround disparities. B, For each pair of surround disparities, we calculated the horizontal shift between disparity tuning curves by fitting a pair of Gabor functions. From this paired fit, we calculated a shift ratio (see Materials and Methods). C, Distribution of shift ratios for 201 surround pairings from 45 neurons. Note that shift ratios are distributed around zero, with a slight but significant bias toward positive values (sign test, p < 0.0001). Filled bars denote shift ratios that were significantly different from zero (Sequential F test, p < 0.05; 52 of 201 shifts). Error bars indicate SE.
Figure 9.
Figure 9.
Comparison of neuronal sensitivity in V1 and MT for the fine task. V1 data (open symbols) are from the study by Prince et al. (2000), and MT data (filled symbols) are from the same sample as in Figure 3. For comparison with V1, the MT data were reanalyzed using the same orthoneuron formulation and fitting procedures used in the V1 study.

Similar articles

Cited by

References

    1. Bradley DC, Andersen RA (1998). Center-surround antagonism based on disparity in primate area MT. J Neurosci 18:7552–7565. - PMC - PubMed
    1. Britten KH, Van Wezel RJ (1998). Electrical microstimulation of cortical area MST biases heading perception in monkeys. Nat Neurosci 1:59–63. - PubMed
    1. Britten KH, Van Wezel RJ (2002). Area MST and heading perception in macaque monkeys. Cereb Cortex 12:692–701. - PubMed
    1. Britten KH, Shadlen MN, Newsome WT, Movshon JA (1992). The analysis of visual motion: a comparison of neuronal and psychophysical performance. J Neurosci 12:4745–4765. - PMC - PubMed
    1. Burkhalter A, Van Essen DC (1986). Processing of color, form and disparity information in visual areas VP and V2 of ventral extrastriate cortex in the macaque monkey. J Neurosci 6:2327–2351. - PMC - PubMed

Publication types

LinkOut - more resources