Comparative Study
. 2006 Jun 21;26(25):6841-50.
doi: 10.1523/JNEUROSCI.1280-06.2006.

Sustained elevation of dendritic calcium evokes widespread endocannabinoid release and suppression of synapses onto cerebellar Purkinje cells

Affiliations
Comparative Study

Sustained elevation of dendritic calcium evokes widespread endocannabinoid release and suppression of synapses onto cerebellar Purkinje cells

Stephan D Brenowitz et al. J Neurosci. .

Abstract

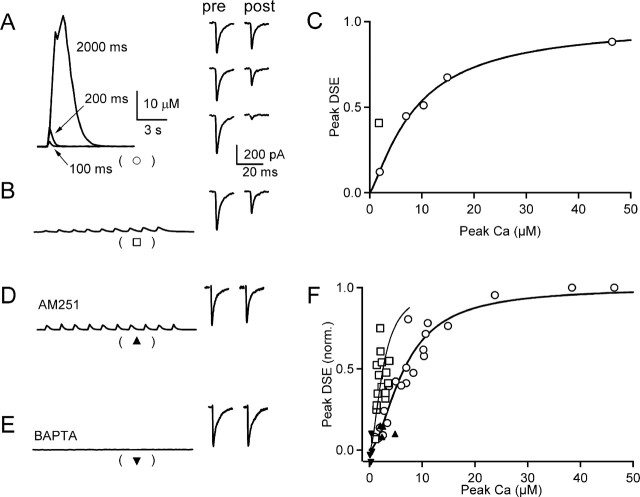
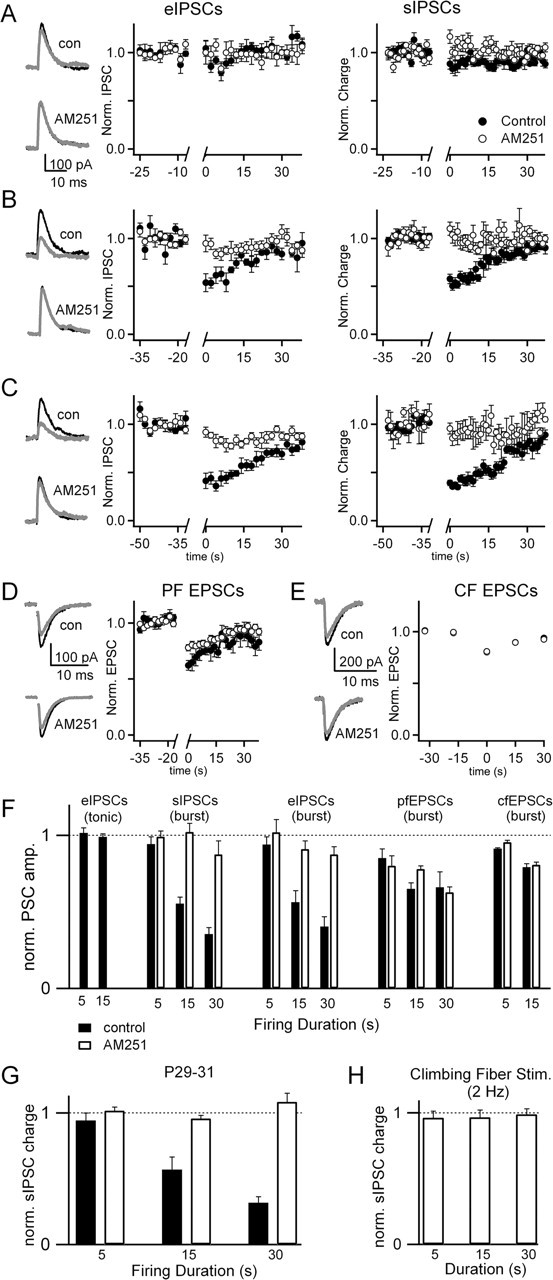
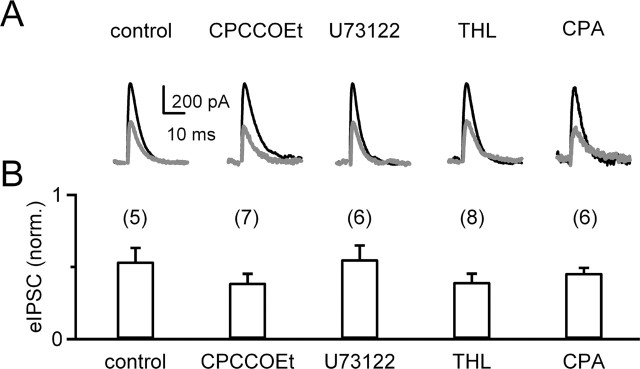
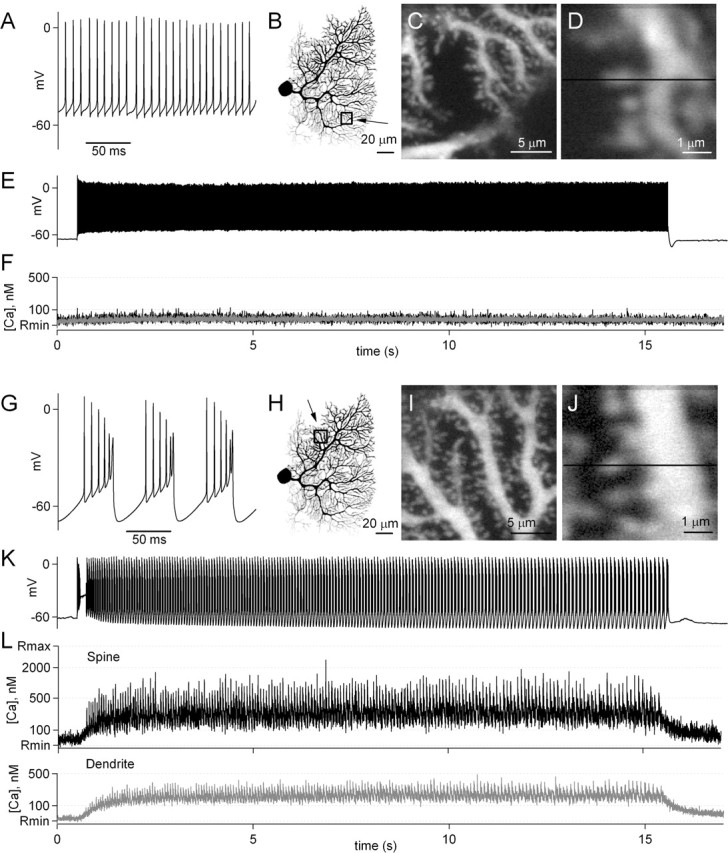
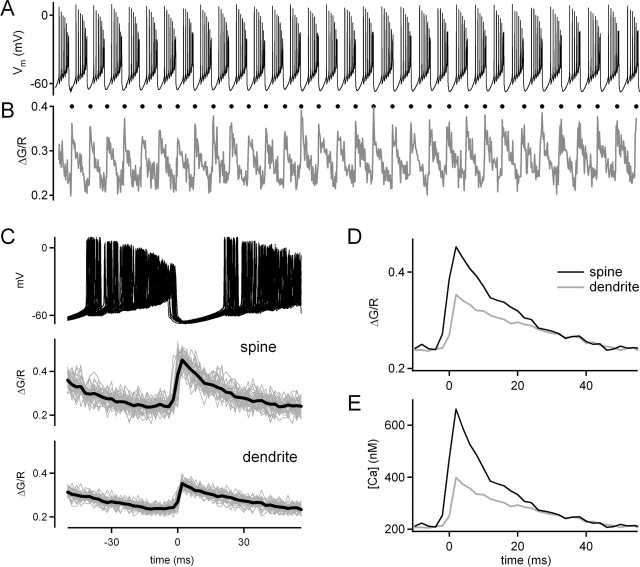
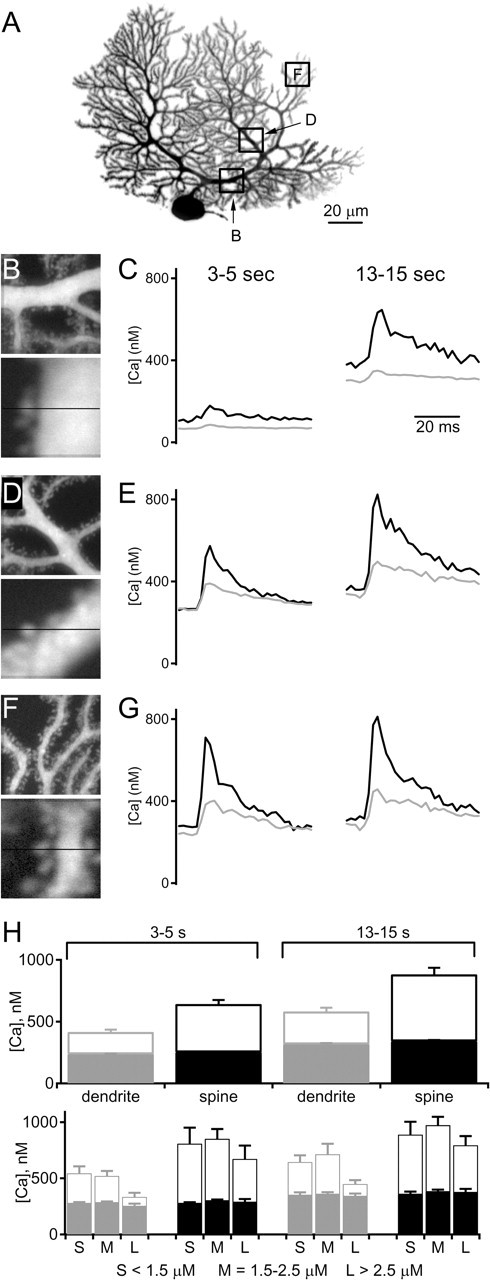
Endocannabinoids can act as retrograde messengers that allow postsynaptic cells to regulate the strength of their synaptic inputs. In the cerebellum, Purkinje cells (PCs) release endocannabinoids through two mechanisms. Synaptic activation evokes local endocannabinoid release that relies on a pathway that involves the metabotropic glutamate receptor mGluR1 and phospholipase-C (PLC). In contrast, depolarization evokes endocannabinoid release from the entire dendritic arbor. This leads to depolarization-induced suppression of inhibitory (DSI) and excitatory (DSE) synapses by a mechanism that does not involve mGluR1 or PLC. This latter mechanism of endocannabinoid release has only been observed under artificial conditions that transiently elevate postsynaptic calcium to >5 microm. Here, we tested the possibility that this mechanism could lead to retrograde inhibition in response to more realistic calcium signals. At both climbing fiber and inhibitory synapses onto PCs, we found that prolonging the elevation of calcium significantly lowered the peak calcium required to evoke PLC-independent endocannabinoid release. This suggests that the mechanism of endocannabinoid release involved in DSI and DSE is likely to evoke endocannabinoid release in response to physiologically relevant levels of calcium. When dendritic calcium was elevated to 0.4-1 microm for 15 s or more, endocannabinoid release from PCs selectively suppressed inhibitory synapses. This suggests that inhibitory synapses are more sensitive to prolonged calcium increases. Thus, in contrast to localized retrograde inhibition evoked by synaptic activation, modest but sustained calcium elevation could globally suppress inhibitory synapses onto PCs.


Figures

Figure 1.
Figure 1.
Prolonged calcium elevations lower the peak calcium required for endocannabinoid-dependent retrograde inhibition. Purkinje cells were voltage clamped with a Cs-based internal containing the calcium indicator fura-FF (500 μm). Cells were held at −60 mV and depolarized to 0 mV, the resulting calcium transient was measured, and the effect on the CF response was determined. A representative experiment (A–C) shows calcium transients arising from single depolarizations of 100, 200, and 2000 ms (A, left) and the corresponding CF EPSCs measured 13 s before and 2 s after these depolarizations (A, right). The calcium transient evoked in the same cell by a series of 75 ms depolarizations every 1.5 s (B, left) is also shown along with the corresponding CF EPSCs (B, right). C, A summary of the peak DSE as a function of the peak calcium levels produced by single depolarizations (open circles) is well approximated by the Hill equation DSE = (1 + (Ca0.5/Capost)m)−1, with Ca0.5 = 8.9 μm and m = 1.25. DSE arising from a series of brief (75 ms) depolarizations (open squares) does not lie on the curve. D, E, The calcium signal evoked by a series of brief depolarizations and the corresponding CF EPSCs 2 s before and 2 s after are shown for an experiment in which 2 μm AM251 was in the bath (D) and 20 mm BAPTA was included in the pipette (E). F, Summary of experiments in which the peak DSE is plotted as a function of the peak calcium for control conditions (open circles; n = 5) and for a series of brief depolarizations in control conditions (open squares; n = 9) in the presence of AM251 (triangle; n = 4) and with BAPTA in the pipette (inverted triangle; n = 4). The Hill equation was used to fit data from experiments with a single depolarization (thick line; Ca0.5 = 6.6 ± 0.4 μm and m = 1.7 ± 0.2) and with a series of 75 ms depolarizations (thin line; Ca0.5 = 2.6 ± 0.3 μm and m = 1.7 ± 0.3).
Figure 2.
Figure 2.
Assessing the effects of tonic firing and burst firing on inhibitory synaptic inputs to Purkinje cells. A, Examples of the typical firing patterns in tonic mode and burst mode are shown. B, Cells were voltage clamped with a potassium-based internal solution at −60 mV and then switched to current clamp in which the cell was allowed to fire in either tonic mode or burst mode, and then cells were returned to voltage clamp. While in voltage clamp, synaptic inputs were activated and the resulting synaptic currents were measured.
Figure 3.
Figure 3.
The effects of Purkinje cell activity on synaptic inputs from inhibitory interneurons, parallel fibers, and climbing fibers. Experiments were performed as in Figure 2. Evoked and sIPSCs were measured in the presence of NBQX, and the effects of burst mode firing for 5 s (A), 15 s (B), and 30 s (C) were assessed. Representative traces are shown for eIPSCs 2–6 s before (black) and 2–6 s after (gray) burst firing in control conditions and in the presence of AM251 (A–C, left). Summaries of the eIPSCs (A–C, middle) and sIPSCs (A–C, right) are shown for control conditions (filled circles) and in the presence of AM251 (open circles). Similar experiments with 15 s bursts were performed for PF EPSCs (D) and CF EPSCs (E), with picrotoxin in the bath to block IPSCs. F, The effects of tonic and burst firing are shown for the various types of synapses for control conditions and in the presence of AM251. The number of experiments performed under each condition ranged from 5 to 14. Data were analyzed by calculating the ratio of the average of three responses after burst firing to the average of three responses preceding the burst. G, Effects of burst firing on sIPSCs in P29–P31 animals was measured under control conditions and in the presence of AM251 (control, n = 4; AM251, n = 4). H, The effects of 2 Hz climbing fiber stimulation for durations of 5, 15, and 30 s on sIPSCs was measured (n = 10) in P15–P17 animals.
Figure 4.
Figure 4.
Pharmacological studies indicate that burst-evoked suppression of inhibitory synapses is similar to DSI and differs from synaptically evoked suppression of synaptic strength. The suppression of eIPSCs by 15 s in burst mode was examined as in Figures 2 and 3. A, Traces from representative experiments are shown for the eIPSCs measured before (black) and after (gray) burst firing in control conditions and after bath application of the mGluR1 antagonist CPCCOEt (100 μm), the PLC antagonist U73122 (5 μm, bath applied for 1 h), the DAG lipase inhibitor THL (2 μm) loaded in the recording pipette, and CPA, the inhibitor of endoplasmic reticulum calcium ATPase (30 μm, bath applied for 1 h). B, Results are summarized with numbers above the bars indicating the number of experiments performed for each condition.
Figure 5.
Figure 5.
Dendritic calcium increases in Purkinje cells during firing in tonic and burst mode. A representative experiment is shown in which calcium levels within dendrites and spines were measured during Purkinje cell firing. Whole-cell current-clamp recordings were made from Purkinje cells with an electrode containing the calcium indicator fluo-5F, and calcium transients were measured as the Purkinje cell fired in tonic mode (AF) and burst mode (G–L). As shown in an expanded view, this Purkinje cell fired at ∼100 Hz in tonic mode (A). B, A two-photon image has been inverted to show the morphology of the cell, and a box shows the region displayed on an expanded scale in C. An additional expanded view (D) shows the path of a line scan used to measure calcium levels within a spine and a dendrite. E, Spontaneous firing of the Purkinje cell was suppressed by small hyperpolarizing currents, and then a small depolarization caused the cell to tonically fire for 15 s. F, The calcium transients measured during tonic firing are shown for the spine and dendrite shown in D. Another trial is shown in which slightly larger currents were injected into the Purkinje cell, which caused the cell to fire in burst mode (G–L). Calcium was measured in the dendritic region shown in H–J. During 15 s of burst firing (K), calcium transients were measured in the spine and dendrite (L) in the region indicated by the line in J.
Figure 6.
Figure 6.
Timing and quantification of calcium signals during burst mode. Whole-cell recordings were made from Purkinje cells with an internal solution containing the green calcium indicator fluo-5F (500 μm) and the red indicator Alexa 594 (20 μm). Burst mode firing (A) evoked changes in calcium that resulted in a change in the ratio of green and red fluorescence (B). The first derivative of the fluorescence transients was used to determine the timing of the calcium transients, which are indicated by dots above the trace in B. The peaks determined from the dendritic calcium spikes were used to align the firing of the Purkinje cells (C, top), the spine calcium (C, middle), and the dendritic calcium (C, bottom). The average ΔG/R values (black) were determined from the individual traces (gray). The average ΔG/R values were replotted for the spine (black) and the dendrite (gray) (D) and were used to determine the calcium levels in the spine and dendrite (E).
Figure 7.
Figure 7.
Calcium transients during Purkinje cell burst firing. A–G, Example of an experiment in which dendritic and spine calcium were determined in different parts of a cell during burst firing as in Figure 6. A, Image of a Purkinje cell showing representative regions in which calcium levels were measured. These regions are shown in an expanded view (B, D, F, top) and in an additional expanded view indicating the path of the line scan used to measure spine and dendritic calcium levels (B, D, F, bottom). Average calcium levels in spines (black) and dendrites (gray) for the period 3–5 s (C, E, G, left) and 13–15 s (C, E, G, right) from the onset of burst firing. H, Summary of the calcium transients measured in spines and dendrites during burst firing (top; n = 16 neurons, 93 regions). Filled bars indicate average baseline calcium, and open bars indicate peak calcium levels during bursts. In the bottom graph, data were divided into three groups consisting of dendrites <1.5, 1.5–2.5, and >2.5 μm in diameter

References

    1. Bacci A, Huguenard JR, Prince DA (2004). Long-lasting self-inhibition of neocortical interneurons mediated by endocannabinoids. Nature 431:312–316. - PubMed
    1. Brenowitz SD, Regehr WG (2003). Calcium dependence of retrograde inhibition by endocannabinoids at synapses onto Purkinje cells. J Neurosci 23:6373–6384. - PMC - PubMed
    1. Brenowitz SD, Regehr WG (2005). Associative short-term synaptic plasticity mediated by endocannabinoids. Neuron 45:419–431. - PubMed
    1. Brown SP, Brenowitz SD, Regehr WG (2003). Brief presynaptic bursts evoke synapse-specific retrograde inhibition mediated by endogenous cannabinoids. Nat Neurosci 6:1048–1057. - PubMed
    1. Chevaleyre V, Castillo PE (2003). Heterosynaptic LTD of hippocampal GABAergic synapses: a novel role of endocannabinoids in regulating excitability. Neuron 38:461–472. - PubMed

Publication types

MeSH terms

LinkOut - more resources