Comparative Study
. 2006 Sep 15;575(Pt 3):937-52.
doi: 10.1113/jphysiol.2006.113936. Epub 2006 Jun 22.

Arterial oxygenation influences central motor output and exercise performance via effects on peripheral locomotor muscle fatigue in humans

Affiliations
Comparative Study

Arterial oxygenation influences central motor output and exercise performance via effects on peripheral locomotor muscle fatigue in humans

Markus Amann et al. J Physiol. .

Abstract

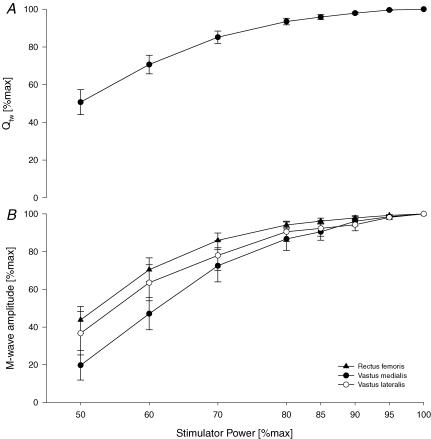
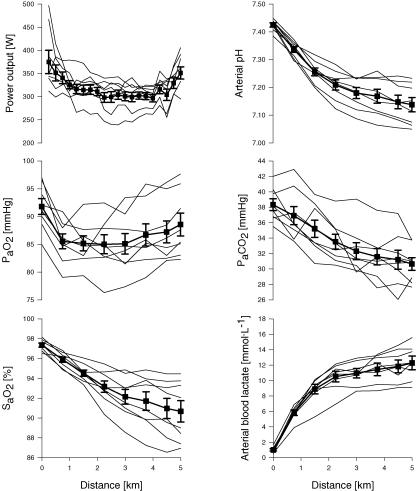
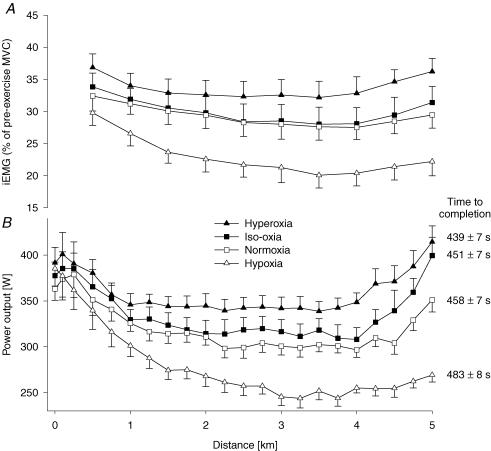
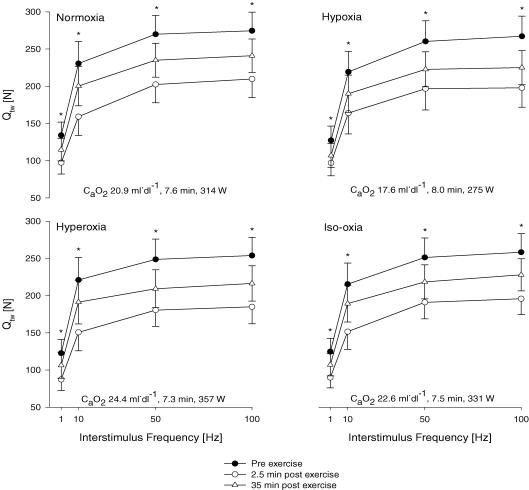
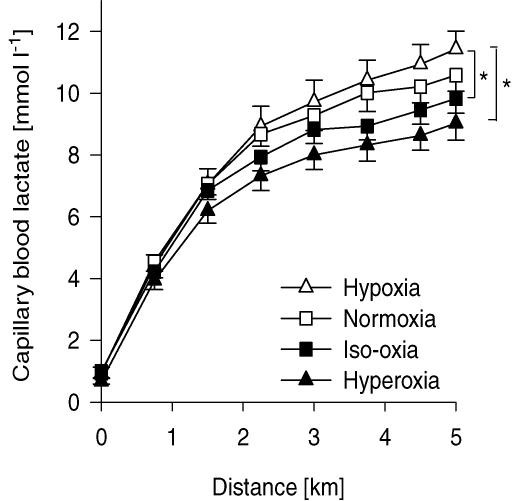
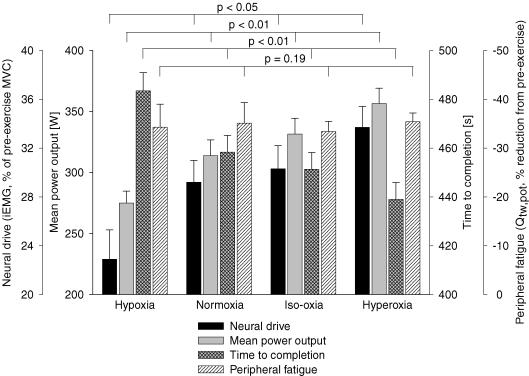
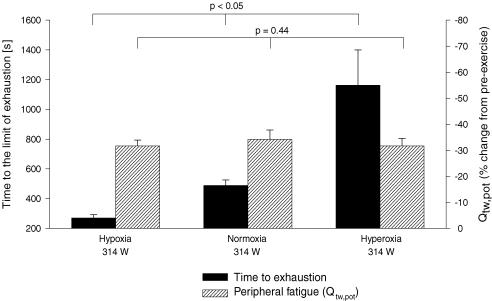
Changing arterial oxygen content (C(aO(2))) has a highly sensitive influence on the rate of peripheral locomotor muscle fatigue development. We examined the effects of C(aO(2)) on exercise performance and its interaction with peripheral quadriceps fatigue. Eight trained males performed four 5 km cycling time trials (power output voluntarily adjustable) at four levels of C(aO(2)) (17.6-24.4 ml O(2) dl(-1)), induced by variations in inspired O(2) fraction (0.15-1.0). Peripheral quadriceps fatigue was assessed via changes in force output pre- versus post-exercise in response to supra-maximal magnetic femoral nerve stimulation (DeltaQ(tw); 1-100 Hz). Central neural drive during the time trials was estimated via quadriceps electromyogram. Increased C(aO(2)) from hypoxia to hyperoxia resulted in parallel increases in central neural output (43%) and power output (30%) during cycling and improved time trial performance (12%); however, the magnitude of DeltaQ(tw) (-33 to -35%) induced by the exercise was not different among the four time trials (P > 0.2). These effects of C(aO(2)) on time trial performance and DeltaQ(tw) were reproducible (coefficient of variation = 1-6%) over repeated trials at each F(IO(2)) on separate days. In the same subjects, changing C(aO(2)) also affected performance time to exhaustion at a fixed work rate, but similarly there was no effect of Delta C(aO(2)) on peripheral fatigue. Based on these results, we hypothesize that the effect of C(aO(2)) on locomotor muscle power output and exercise performance time is determined to a significant extent by the regulation of central motor output to the working muscle in order that peripheral muscle fatigue does not exceed a critical threshold.


Figures

Figure 1
Figure 1. Quadriceps twitch force (Qtw;A) and M-wave amplitudes (B) as a direct response to magnetic stimulation of the femoral nerve applying single twitches (1 Hz) at increasing stimulator power settings (FIO20.21)
The incremental protocol was applied after a 10 min rest period and completed 15 min before the pre-exercise assessment of neuromuscular function. The electromyographic activity was recorded from three pairs of surface electrodes (rectus femoris, vastus medialis, vastus lateralis) and M-wave amplitudes were analysed using a customized software program. n = 8.
Figure 2
Figure 2. Effects of 5 km time trial in normoxia (FIO20.21) on power output and arterial blood measurements
Thick lines represent group mean data; thin lines represent individual subject data (n= 8). Mean time for the time trial was 483.4 ± 7.5 s (range 437.5–478.4 s). [Hb] was 14.4 ± 0.5 g l−1 and CaO2 was 19.8 ± 0.8 ml O2 dl−1 at rest, and 16.4 ± 0.7 g l−1 and 20.9 ± 1.0 ml O2 dl−1 at 5 km.
Figure 3
Figure 3. Effect of ΔCaO2 on motor output and muscle power output during the 5 km time trial
A, effects of various CaO2 values on group mean integrated EMG (iEMG) of vastus lateralis normalized to the iEMG obtained during pre-exercise maximal voluntary contractions (MVCs). Each point represents the mean iEMG of the preceding 0.5 km section. Mean iEMG during the time trial was significantly increased from hypoxia to hyperoxia (P < 0.05). B, group mean variations in power output during the 5 km time trial in four different conditions. Group mean power output was 356.5 ± 12.5 W, 331.0 ± 12.9 W, 313.8 ± 12.9 W and 275.0 ± 9.7 W (P < 0.05) for hyperoxia (FIO2, SpO2, CaO2) 1.0, 100%, 24 ml dl−1; iso-oxia 0.28, 98%, 23 ml dl−1; normoxia 0.21, 91%, 21 ml dl−1; and hypoxia 0.15, 77%, 18 ml dl−1, respectively. n= 8.
Figure 4
Figure 4. Effects of Δ CaO2during the 5 km time trial on absolute values for group mean force–frequency responses of the quadriceps muscle pre-, 2.5 min and 35 min post-time-trial (various workloads and performance times) in four conditions elicited by supramaximal magnetic femoral nerve stimulation
Normoxia: (FIO2, SpO2) 0.21, 91%; hypoxia: 0.15, 77%; hyperoxia: 1.00, 100%; iso-oxia: 0.28, 98%. Quadriceps twitch forces (Qtw) are represented as a direct response to single (1 Hz) and three paired twitches with various interstimulus durations (100 ms ∼10 Hz, 20 ms ∼50 Hz, 10 ms ∼100 Hz). *Significant differences between Qtw pre-, 2.5 min post- and 35 min post-exercise (P < 0.01). n= 8.
Figure 5
Figure 5. Group mean capillary blood lactate obtained during the 5 km time trials in various conditions
The asterisks indicate significance at 5 km (*P < 0.05). Hypoxia: (FIO2, SpO2, CaO2) 0.15, 77%, 18 ml dl−1; normoxia: 0.21, 91%, 21 ml dl−1; iso-oxia: 0.28, 98%, 23 ml dl−1; hyperoxia: 1.0, 100%, 24 ml dl−1. n = 8.
Figure 6
Figure 6. Summary ofCaO2effects on time trial group mean neural drive (iEMG, vastus lateralis), power output, time to completion and end-exercise peripheral quadriceps fatigue
Peripheral locomotor muscle fatigue is represented as percentage reduction in potentiated single twitch force (Qtw,pot) from pre-exercise baseline. Hypoxia: (FIO2, SpO2, CaO2) 0.15, 77%, 18 ml dl−1; normoxia: 0.21, 91%, 21 ml dl−1; iso-oxia: 0.28, 98%, 23 ml dl−1; hyperoxia: 1.0, 100%, 24 ml dl−1. n = 8.
Figure 7
Figure 7. Performance characteristics of various time to the limit of exhaustion (Tlim) trials
Group mean Tlim, mean constant power output (313.8 ± 12.9 W) and end-exercise peripheral quadriceps fatigue. Peripheral locomotor muscle fatigue is represented as percentage reduction in potentiated single twitch force (Qtw,pot) from pre-exercise baseline. Hypoxia: (FIO2, SpO2, CaO2) 0.15, 82%, 18 ml dl−1; normoxia: 0.21, 93%, 21 ml dl−1; hyperoxia: 1.0, 100%, 25 ml dl−1. n = 8.

Comment in

References

    1. Adams RP, Welch HG. Oxygen uptake, acid-base status, and performance with varied inspired oxygen fractions. J Appl Physiol. 1980;49:863–868. - PubMed
    1. Amann M, Romer LM, Pegelow DF, Jacques AJ, Hess CJ, Dempsey JA. The effects of arterial oxygen content upon peripheral locomotor muscle fatigue. J Appl Physiol. 2006;101:119–127. - PubMed
    1. Amann M, Subudhi A, Foster C. Influence of testing protocol on ventilatory thresholds and cycling performance. Med Sci Sports Exerc. 2004;36:613–622. - PubMed
    1. Arbogast S, Vassilakopoulos T, Darques JL, Duvauchelle JB, Jammes Y. Influence of oxygen supply on activation of group IV muscle afferents after low-frequency muscle stimulation. Muscle Nerve. 2000;23:1187–1193. - PubMed
    1. Bigland-Ritchie BR, Dawson NJ, Johansson RS, Lippold OC. Reflex origin for the slowing of motoneurone firing rates in fatigue of human voluntary contractions. J Physiol. 1986;379:451–459. - PMC - PubMed

Publication types

MeSH terms

LinkOut - more resources