. 2006 Jul;240(1):263-72.
doi: 10.1148/radiol.2401050717.

Uterine leiomyomas: MR imaging-based thermometry and thermal dosimetry during focused ultrasound thermal ablation

Affiliations

Uterine leiomyomas: MR imaging-based thermometry and thermal dosimetry during focused ultrasound thermal ablation

Nathan McDannold et al. Radiology. 2006 Jul.

Abstract

Purpose: To retrospectively evaluate magnetic resonance (MR) imaging-based thermometry and thermal dosimetry during focused ultrasound treatments of uterine leiomyomas (ie, fibroids).

Materials and methods: All patients gave written informed consent for the focused ultrasound treatments and the current HIPAA-compliant retrospective study, both of which were institutional review board approved. Thermometry performed during the treatments of 64 fibroids in 50 women (mean age, 46.6 years +/- 4.5 [standard deviation]) was used to create thermal dose maps. The areas that reached dose values of 240 and 18 equivalent minutes at 43 degrees C were compared with the nonperfused regions measured on contrast material-enhanced MR images by using the Bland-Altman method. Volume changes in treated fibroids after 6 months were compared with volume changes in nontreated fibroids and with MR-based thermal dose estimates.

Results: While the thermal dose estimates were shown to have a clear relationship with resulting nonperfused regions, the nonperfused areas were, on average, larger than the dose estimates (means of 1.9 +/- 0.7 and 1.2 +/- 0.4 times as large for areas that reached 240- and 18-minute threshold dose values, respectively). Good correlation was observed for smaller treatment volumes at the lower dose threshold (mean ratio, 1.0 +/- 0.3), but for larger treatment volumes, the nonperfused region extended to locations within the fibroid that clearly were not heated. Variations in peak temperature increase were as large as a factor of two, both between patients and within individual treatments. On average, the fibroid volume reduction at 6 months increased as the ablated volume estimated by using the thermal dose increased.

Conclusion: Study results showed good correlation between thermal dose estimates and resulting nonperfused areas for smaller ablated volumes. For larger treatment volumes, nonperfused areas could extend within the fibroid to unheated areas.


Figures

Figure 1
Figure 1
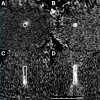
Temperature-sensitive phase-difference fast spoiled gradient-echo (40/20 [repetition time msec/echo time msec], 30° flip angle) MR images acquired during sonications to ensure correct targeting of focal coordinate. A and C were acquired before focal coordinate was corrected; Band D were acquired after correction. A, B, First, sonications were performed with temperature imaging in the coronal plane, or perpendicular to direction of the ultrasound beam. C, D, Next, sonications were performed with imaging orientation sagittal or transverse, parallel to the ultrasound beam direction. Target locations are indicated by a circle in A and B and by a rectangle in C and D.
Figure 2
Figure 2
Left: Graph illustrates mean temperature increase as a function of time for all sonications performed during five separate treatments. Right: Graph illustrates mean temperature increase as a function of time for the individual sonications performed during a single treatment. For each sonication, the measured temperature increase was detected in a 3 × 3-voxel region centered on the hottest voxel. Each temperature profile was scaled on the basis of the acoustic power levels used so that they could be compared with one another. Inset in left graph illustrates the mean peak temperature increase values achieved (± standard deviation). Actual acoustic power levels were 117–195 W (mean, 172.3 W ± 24.7) for patient 1, 116 –160 W (mean, 146.5 W ± 20.1) for patient 2, 130 –145 W (mean, 140.0 W ± 7.3) for patient 3, 110 W for patient 4, and 100 –160 W (mean, 131.3 W ± 20.3) for patient 5.
Figure 3
Figure 3
Normal and atypical heating distributions observed on temperature-sensitive phase-difference fast spoiled gradient-echo (40/20,30° flip angle) MR images. A, Normal heating distribution. B, Temperature distribution when boiling or cavitation occurred. C, Temperature distribution when the ultrasound beam was focused on a blood vessel or fluid-filled region (gap near center of region of heating). D, Temperature distribution when sonication of a calcified fibroid (patient treated in a later study) was performed. In all examples, imaging was performed parallel to the direction of the ultrasound beam.
Figure 4
Figure 4
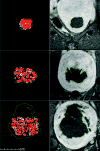
Three typical examples of (left) areas that reached thermal dose values of at least 240 and 18 minutes and (right) corresponding posttreatment contrast-enhanced T1-weighted fast spoiled gradient-echo MR images (200/1.8, 80° flip angle). The thermal dose was estimated from temperature-sensitive image findings. Imaging was performed perpendicular to the direction of the ultrasound beam (coronal). On the dose images (left), areas that reached a thermal dose of at least 240 minutes are red and areas that reached a thermal dose of at least 18 minutes are white.
Figure 5
Figure 5
Top: Scatterplots illustrate comparison between the areas in the central coronal plane of the treatments that reached thermal dose values of 240 (left) and 18 (right) minutes and the corresponding nonperfused areas at contrast-enhanced MR imaging performed immediately after the treatments. Linear regression of the data yielded correlation coefficients of 0.88 and 0.89 for the 240- and 18-minute dose thresholds, respectively. The line indicates unity. Bottom: Corresponding Bland-Altman plots of the ratio of the two area measurements (thermal dose and MR perfusion) as a function of the average of the two measurements. Shaded areas indicate limits of agreement (mean ratio ± 1.96 standard deviations). Solid lines indicate ratio of 1.
Figure 6
Figure 6
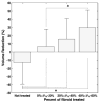
Graph illustrates fibroid volume reduction 6 months after treatment as a function of the estimated percentage of the fibroid volume that was treated (ie, VTD). The treated volume was estimated from the MR imaging– based thermal dose estimates; the 18-minute threshold was used for these estimates. The mean volume change (± standard deviation) for 15 fibroids in the patient group that were not treated with focused ultrasound also is shown.

References

    1. Ishihara Y, Calderon A, Watanabe H, Okamoto K, Suzuki Y, Kuroda K. A precise and fast temperature mapping using water proton chemical shift. Magn Reson Med. 1995;34(6):814–823. - PubMed
    1. Hindman JC. Proton resonance shift of water in the gas and liquid states. J Chem Phys. 1966;44:4582–4592.
    1. Peters RD, Hinks RS, Henkelman RM. Ex vivo tissue-type independence in proton-resonance frequency shift MR thermometry. Magn Reson Med. 1998;40(3):454–459. - PubMed
    1. Kuroda K, Chung AH, Hynynen K, Jolesz FA. Calibration of water proton chemical shift with temperature for noninvasive temperature imaging during focused ultrasound surgery. J Magn Reson Imaging. 1998;8(1):175–181. - PubMed
    1. De Poorter J. Noninvasive MRI thermometry with the proton resonance frequency method: study of susceptibility effects. Magn Reson Med. 1995;34(3):359–367. - PubMed

Publication types