. 2006 Jul;244(1):52-60.
doi: 10.1097/01.sla.0000217617.06782.d5.

Genetic differentiation of appendiceal tumor malignancy: a guide for the perplexed

Affiliations

Genetic differentiation of appendiceal tumor malignancy: a guide for the perplexed

Irvin M Modlin et al. Ann Surg. 2006 Jul.

Abstract

Objective: To use differential gene expression of candidate markers to discriminate benign appendiceal carcinoids (APCs) from malignant and mixed cell APCs.

Summary background data: Controversy exists in regard to the appropriate surgical management of APCs since it is sometimes difficult to predict tumor behavior using traditional pathologic criteria. We have identified 5 differentially expressed genes (a mitosis-regulatory gene NAP1L1, an adhesin MAGE-D2, an estrogen-antagonist, the metastasis marker MTA1, the apoptotic marker NALP, and chromogranin A) that define gut neuroendocrine cell behavior.

Methods: Total RNA was isolated using TRIzol reagent from 42 appendiceal samples, including appendiceal carcinoids identified at exploration for appendicitis (no evidence of metastasis; n = 16), appendicitis specimens (n = 11), malignant appendiceal tumors (> 1.5 cm, evidence of metastatic invasion; n = 7), and mixed (goblet) cell appendiceal adenocarcinoids (n = 3), normal appendiceal tissue (n = 5), and 5 colorectal cancers. Gene expression (CgA, NAP1L1, MAGE-D2, MTA1, and NALP1) was examined by Q-RT PCR (Applied Biosystems) and quantified against GAPDH.

Results: CgA message was elevated (> 1000-fold, P < 0.05) in all tumor types. NAP1L1 was elevated (> 10-fold, P < 0.03) in both malignant and goblet cell adenocarcinoids compared with normal and incidental lesions (P < 0.006). MAGE-D2 and MTA1 message were significantly elevated (> 10-fold, P < 0.01) in the malignant and goblet cell adenocarcinoid tumors but not in the appendicitis-associated carcinoids or normal mucosa. The apoptotic marker, NALP1, was overexpressed (> 50-fold, P < 0.05) in the appendicitis-associated and malignant appendiceal carcinoids but was significantly decreased (> 10-fold, P < 0.05) in the goblet cell adenocarcinoids. Elevated CgA transcript and protein levels indicative of a carcinoid tumor were identified in one acute appendicitis sample with no histologic evidence of a tumor.

Conclusions: These data demonstrate that malignant APCs and goblet cell adenocarcinoids have elevated expression of NAP1L1, MAGE-D2, and MTA1 compared with appendiceal carcinoids identified at surgery for appendicitis. This and the differences in NALP1 gene expression (decreased in goblet cell adenocarcinoids) provide a series of molecular signatures that differentiate carcinoids of the appendix. CgA identified all appendiceal tumors as well as covert lesions, which may be more prevalent than previously recognized. The molecular delineation of malignant appendiceal tumor potential provides a scientific basis to define the appropriate surgical management as opposed to morphologic assessment alone.


Figures
None
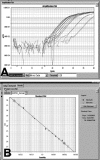
FIGURE 1. Real-time PCR plots using the Assays-on-Demand approach (Applied Biosystems) of the housekeeping gene, GAPDH, in paraffin-embedded appendiceal carcinoid tissue. A, Amplification plot of PCR fluorescence versus cycle number for the pooled carcinoid samples. This demonstrates concentration-dependent amplification of GAPDH. B, Standard curve of GAPDH (CT values plotted vs. the log of the initial amount of cDNA) derived from A. The level of gene expression in a sample is calculated from the CT and standard curve. CT, threshold cycle.
None
FIGURE 2. Message levels of CgA determined by Q RT-PCR. Levels of CgA were significantly overexpressed (∼100 times) in incidental (benign) appendiceal carcinoids (AI), malignant appendiceal carcinoids (AM; >1000 times), and appendiceal carcinoids with goblet cell morphology (AGC; ∼20 times) as compared with normal mucosa (AN). Malignant carcinoids also had elevated CgA levels compared with incidental and goblet cell carcinoids. No differences were noted between colorectal cancer (CRC) samples and normal mucosa (AN). #P = 0.05. *P < 0.05. **P < 0.01. ***P < 0.005. Data are mean ± SEM.
None
FIGURE 3. Message levels of NAP1L1 determined by Q RT-PCR. Levels of NAP1L1 were significantly overexpressed in malignant appendiceal carcinoids (AM; ∼15 times), and in appendiceal carcinoids with goblet cell morphology (AGC; ∼8 times) compared with normal mucosa (AN). Malignant carcinoids also had elevated NAP1L1 levels compared with incidentally identified carcinoids (AI). No significant differences were noted between either incidental (benign) appendiceal carcinoids or colorectal cancer (CRC) samples and normal mucosa. *P = 0.03. **P < 0.01. #P = 0.006. Data are mean ± SEM.
None
FIGURE 4. Message levels of MAGE-D2 determined by Q RT-PCR. Levels of MAGE-D2 were significantly overexpressed in malignant appendiceal carcinoids (AM; ∼100 times), in appendiceal carcinoids with goblet cell morphology (AGC; ∼12 times), and in colorectal cancer (CRC; ∼100 times) samples compared with normal mucosa (AN). No significant differences were noted between incidental (benign) appendiceal carcinoids (AI) or normal mucosa. Malignant carcinoids and CRC tumors had elevated MAGE-D2 levels compared with incidental carcinoids. *P < 0.01. #P < 0.005. **P < 0.001. Data are mean ± SEM.
None
FIGURE 5. Message levels of MTA1 determined by Q RT-PCR. Levels of MTA1 were significantly overexpressed in malignant appendiceal carcinoids (AM; ∼1000 times), in appendiceal carcinoids with goblet cell morphology (AGC; ∼15 times), and in colorectal cancer (CRC; ∼1000 times) samples compared with normal mucosa (AN). No significant differences were noted between incidental (benign) appendiceal carcinoids (AI) or normal mucosa. Malignant carcinoids and CRC tumors had elevated MTA1 levels compared with incidental carcinoids. *P < 0.01. #P < 0.005. **P < 0.001. Data are mean ± SEM.
None
FIGURE 6. Message levels of NALP1 determined by Q RT-PCR. Levels of NALP1 were significantly overexpressed (∼100 times) in incidental (benign) appendiceal carcinoids (AI) and in malignant appendiceal carcinoids (AM; >1000 times) compared with normal mucosa (AN). Levels were significantly decreased in appendiceal carcinoids with goblet cell morphology (AGC; ∼15 times) and in colorectal cancer (CRC; ∼1000 times) samples compared with normal mucosa (AN). Malignant carcinoids had elevated NALP1 levels compared with incidental carcinoids, goblet cell carcinoids, and CRC tumors. #P = 0.05. **P = 0.05. *P < 0.01. ***P < 0.005. Data are mean ± SEM.
None
FIGURE 7. Message levels of CgA determined by Q RT-PCR. Levels of CgA were significantly overexpressed (∼15 times) in the malignant appendiceal tumor and its liver and omental metastases (AM) compared with normal mucosa (AN). Levels were not different from normal mucosa in 10 of the acute appendicitis specimens (A). One acute sample had elevated CgA message. • = acute appendicitis sample with abnormally elevated CgA gene expression. *P < 0.005. Data are mean ± SEM.
None
FIGURE 8. Expression levels of CgA determined by immunohistochemistry in a specimen of acute suppurative appendicitis with elevated CgA transcript levels. Tri-color imaging of this section demonstrated significant overlap between cytoplasmic CgA and cytokeratin staining in discrete areas. These included the area adjacent to the lumen (A) where CgA-positive cells forming glandular-type structures were noted and in fatty areas where individual CgA-positive cells could be noted (B). Yellow arrow heads identify CgA-positive cells. Blue, nuclei (DAPI); green, cytokeratin (Alexa488); red, CgA (Cy5). Dual CgA and cytokeratin staining (red and green) results in a yellow color (original magnification ×100).

References

    1. Modlin I. History of Gastroenterology at the Millenium. Milan: MultiMed, 2000.
    1. Sandor A, Modlin IM. A retrospective analysis of 1570 appendiceal carcinoids. Am J Gastroenterol. 1998;93:422–428. - PubMed
    1. Bernick PE, et al. Neuroendocrine carcinomas of the colon and rectum. Dis Colon Rectum. 2004;47:163–169. - PubMed
    1. Goede AC, Caplin ME, Winslet MC. Carcinoid tumour of the appendix. Br J Surg. 2003;90:1317–1322. - PubMed
    1. Simon SR. Moses Maimonides: medieval physician and scholar. Arch Intern Med. 1999;159:1841–1845. - PubMed

Publication types

MeSH terms