

Mathematical models for hantavirus infection in rodents
- PMID: 16794943
- PMCID: PMC7472466
- DOI: 10.1007/s11538-005-9034-4
Mathematical models for hantavirus infection in rodents
Abstract
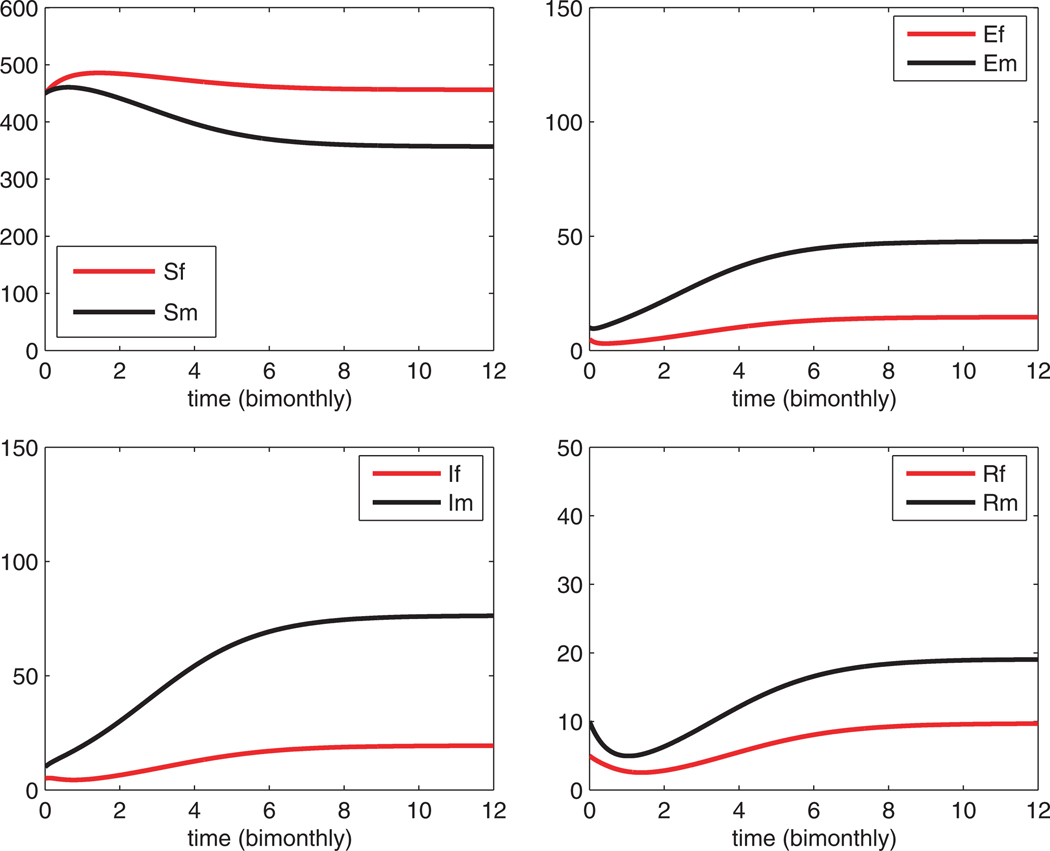
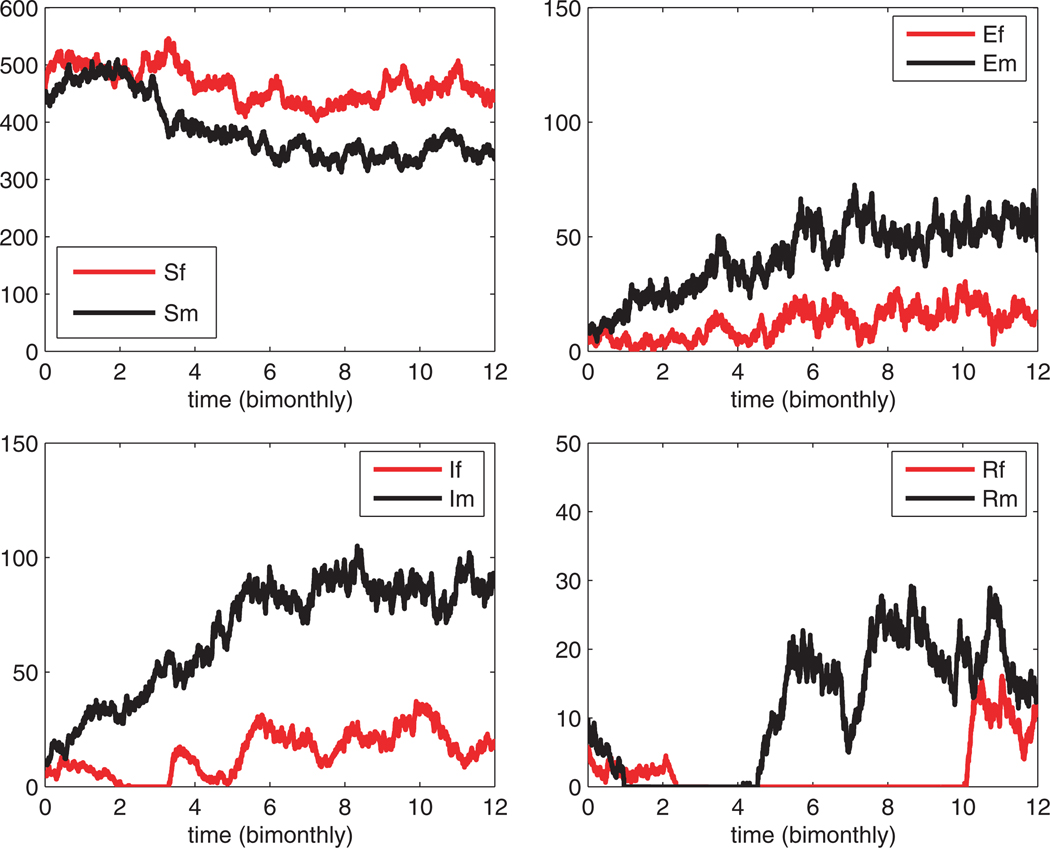
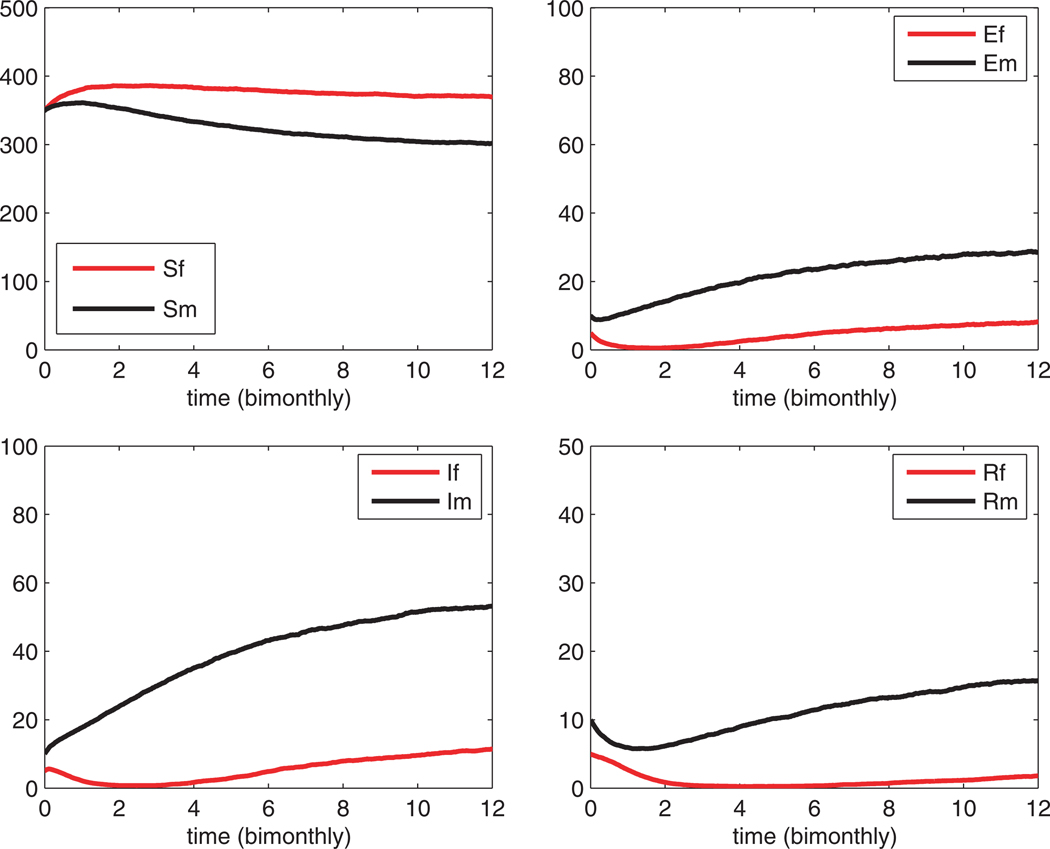
Hantavirus pulmonary syndrome is an emerging disease of humans that is carried by wild rodents. Humans are usually exposed to the virus through geographically isolated outbreaks. The driving forces behind these outbreaks is poorly understood. Certainly, one key driver of the emergence of these viruses is the virus population dynamics within the rodent population. Two new mathematical models for hantavirus infection in rodents are formulated and studied. The new models include the dynamics of susceptible, exposed, infective, and recovered male and female rodents. The first model is a system of ordinary differential equations while the second model is a system of stochastic differential equations. These new models capture some of the realistic dynamics of the male/female rodent hantavirus interaction: higher seroprevalence in males and variability in seroprevalence levels.
Figures
References
-
- Abramson G, Kenkre VM, 2002. Spatiotemporal patterns in hantavirus infection. Phys. Rev. E 66, 011912, 1–5. - PubMed
-
- Abramson G, Kenkre VM, Yates TL, Parmenter RR, 2003. Traveling waves of infection in the hantavirus epidemics. Bull. Math. Biol. 65, 519–534. - PubMed
-
- Allen EJ, 1999. Stochastic differential equations and persistence time for two interacting populations. Dyn. Cont. Discrete Impulsive Syst. 5, 271–281.
-
- Allen LJS, Allen EJ, 2003. A comparison of three different stochastic population models with regard to persistence time. Theor. Pop. Biol. 64, 439–449. - PubMed
-
- Allen LJS, 2003. An Introduction to Stochastic Processes with Applications to Biology. Prentice Hall: Upper Saddle River, N.J.
Publication types
MeSH terms
Grants and funding
LinkOut - more resources
Full Text Sources
Medical
