

doi: 10.1016/j.bbamem.2006.05.010.
Epub 2006 May 19.
Infrared micro-spectroscopic studies of epithelial cells
Affiliations
- PMID: 16797481
- PMCID: PMC2732433
- DOI: 10.1016/j.bbamem.2006.05.010
Item in Clipboard
Infrared micro-spectroscopic studies of epithelial cells
Biochim Biophys Acta.
2006 Jul.
Abstract
We report results from a study of human and canine mucosal cells, investigated by infrared micro-spectroscopy, and analyzed by methods of multivariate statistics. We demonstrate that the infrared spectra of individual cells are sensitive to the stage of maturation, and that a distinction between healthy and diseased cells will be possible. Since this report is written for an audience not familiar with infrared micro-spectroscopy, a short introduction into this field is presented along with a summary of principal component analysis.
Figures
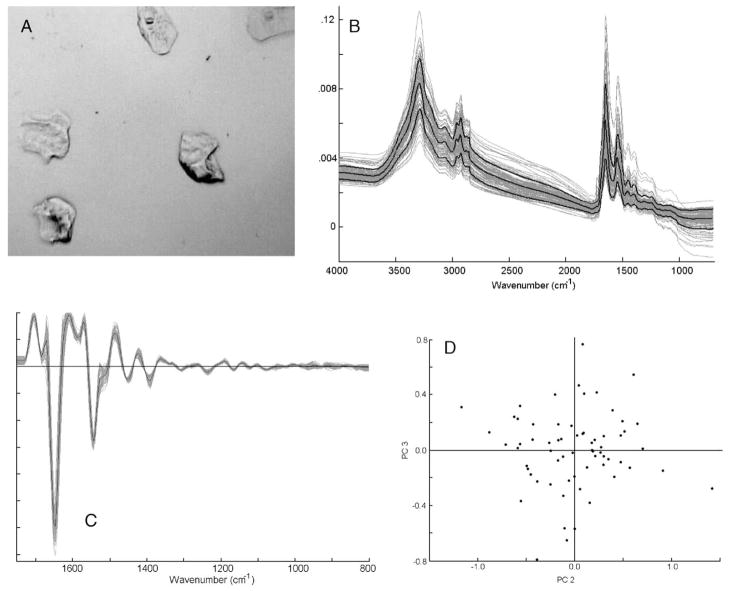
Panel A: photomicrograph of a sample of oral mucosa cells, prepared by the CytoSpin method (see text for detail). Panel B: mid-infrared (800–4000 cm−1) spectra of ca. 60 individual oral mucosa cells from one donor. The heavy black lines denote the mean spectrum, and the standard deviation spectra. Panel C: second derivative spectra of data set shown in Panel B, expanded between 800 and 1800 cm−1 Panel D: Scores plot (PC2 vs. PC3) of data set shown in Panel C. Each dot represents one spectrum.
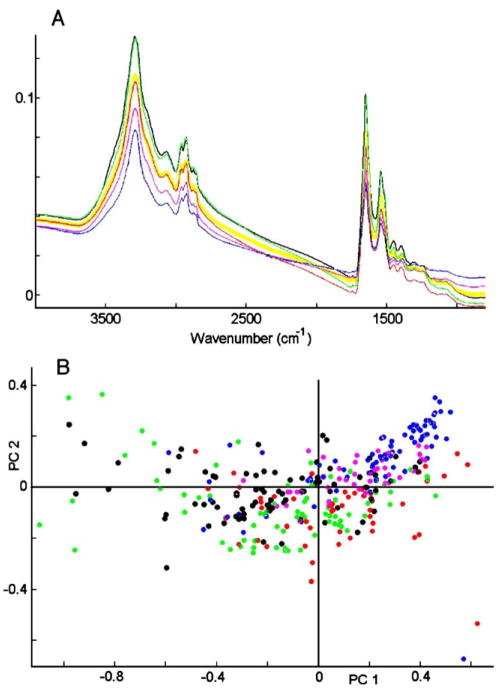
Panel A: spectra of 320 oral mucosa cells, averaged separately for each of 5 donors, (shown as black, blue, green, red and purple traces), and average of all 5 donors (yellow). Panel B: scores plot (PC1 vs. PC2) of data set shown in Panel A. Each dot represents one spectrum.
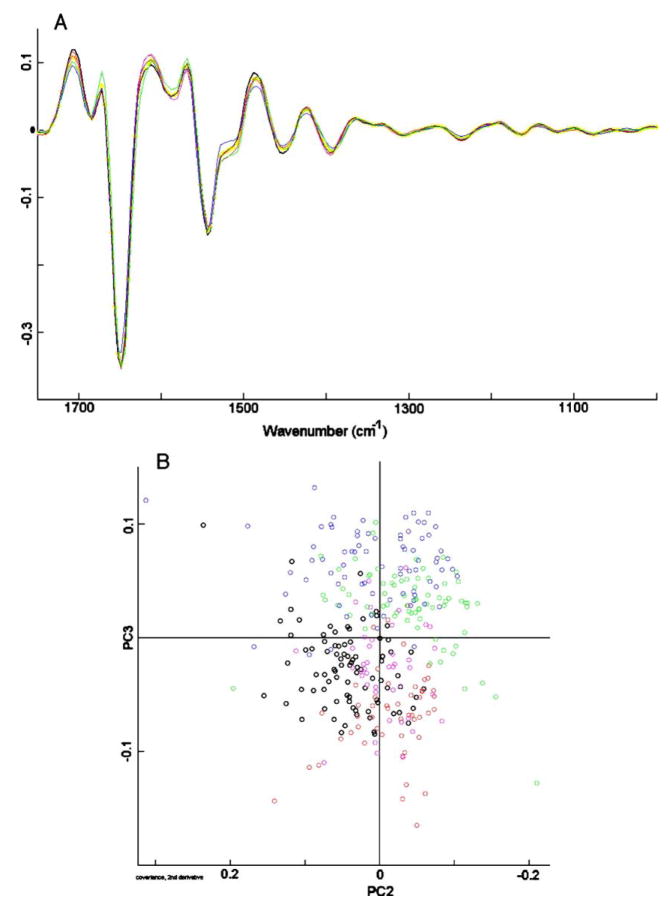
Panel A: second derivative spectra of data set shown in Fig. 2, Panel A, expanded between 800 and 1800 cm−1 Panel B: scores plot (PC2 vs. PC3) of data set shown in Panel A. Each circle represents one spectrum.
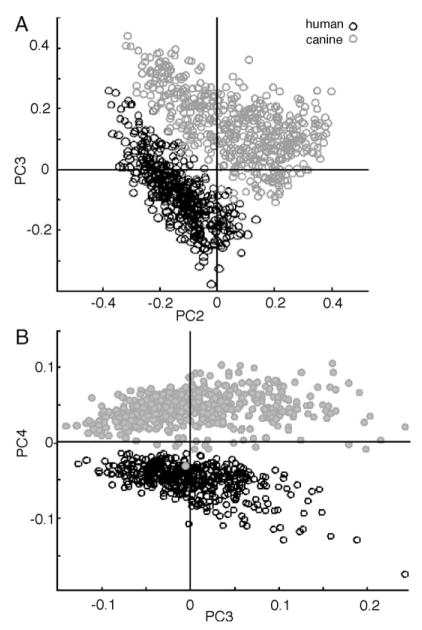
Panel A: scores Plot (PC2 vs. PC3) of nearly 1000 human oral mucosa and canine cervical cells Panel B: scores plot (PC3 vs. PC4) of data set shown in Panel A. Each symbol represents one spectrum.
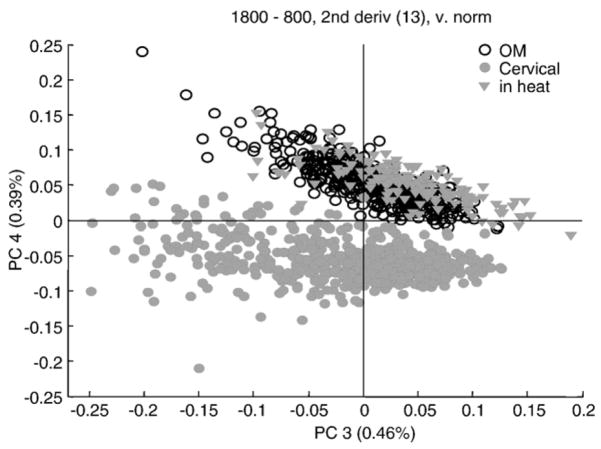
Scores plot (PC3 vs. PC4) of over 1000 human oral mucosa and canine cervical cells, including cervical cells from an estrus dog. Each circle represents one spectrum.
References
-
- Steller W, Einenke J, Horn LC, Braumann UD, Binder H, Salzer R, Krafft C. Delimitation of a squamous cell cervical carcinoma using infrared microspectroscopic imaging. Anal Bioanal Chem. in press. - PubMed
-
- Chiriboga L, Xie P, Yee H, Zarou D, Zakim D, Diem M. Infrared spectroscopy of human tissue. IV. Detection of dysplastic and neoplastic changes of human cervical tissue via infrared microscopy. Cell Mol Biol. 1998;44(1):219–229. - PubMed
-
- Lasch P, Haensch W, Naumann D, Diem M. Imaging of colorectal adenocarcinoma using FTIR micro-spectroscopy and cluster analysis. Biochim Biophys Acta. 2004;1688(2):176–186. - PubMed
-
- Lasch P, Haensch W, Lewis EN, Kidder LH, Naumann D. Characterization of colorectal adenocarcinoma sections by spatially resolved FT-IR microspectroscopy. Appl Spectrosc. 2002;56:1–9.
Publication types
MeSH terms
Grants and funding
LinkOut - more resources
Full Text Sources
Other Literature Sources
