

Imaging correlates of posterior cortical atrophy
- PMID: 16797786
- PMCID: PMC2734142
- DOI: 10.1016/j.neurobiolaging.2006.05.026
Imaging correlates of posterior cortical atrophy
Abstract
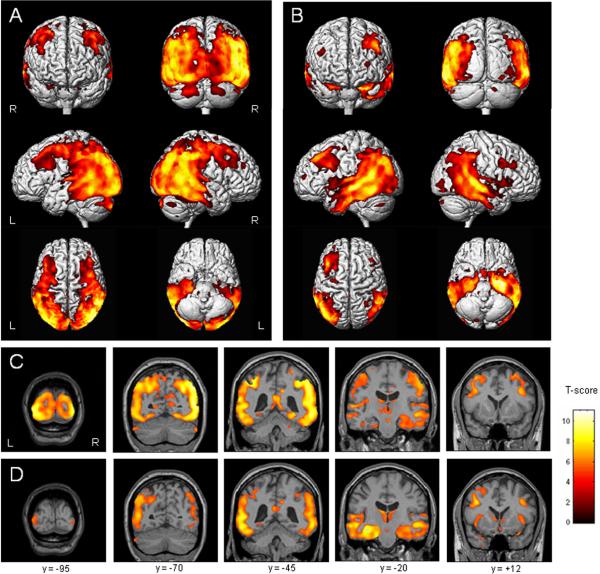
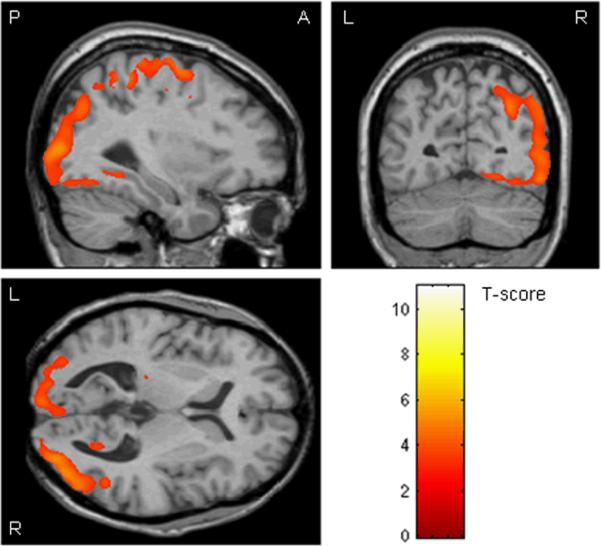
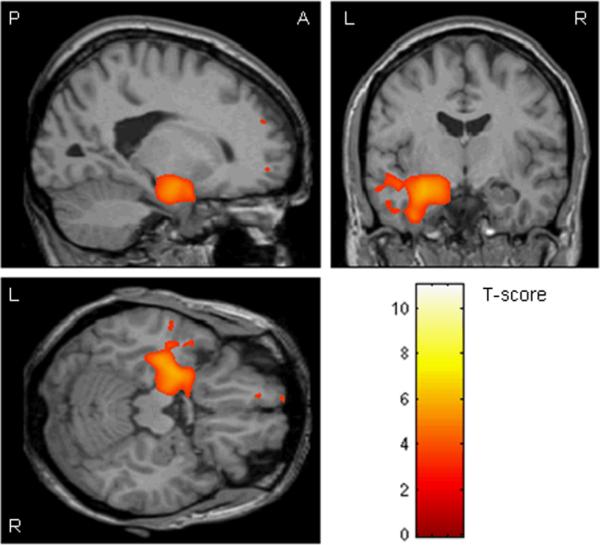
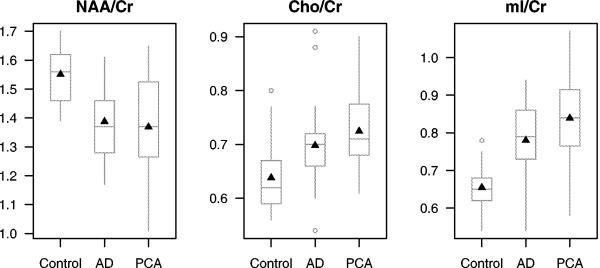
The aim of this study was to compare patterns of cerebral atrophy on MRI, and neurochemistry on magnetic resonance spectroscopy (MRS), in patients with posterior cortical atrophy (PCA) and typical Alzheimer's disease (AD). Voxel-based morphometry was used to assess grey matter atrophy in 38 patients with PCA, 38 patients with typical AD, and 38 controls. Clinical data was assessed in all PCA patients. Single voxel (1)H MRS located in the posterior cingulate was analyzed in a subset of patients with PCA, typical AD, and control subjects. PCA showed a pattern of atrophy affecting occipital, parietal and posterior temporal lobes, compared to controls. The pattern was bilateral, but more severe on the right. Patients with PCA showed greater atrophy in the right visual association cortex than patients with typical AD, whereas those with AD showed greater atrophy in the left hippocampus than those with PCA. (1)H MRS suggested loss of neuronal integrity and glial activation in subjects with PCA and typical AD. The differing patterns of atrophy on MRI suggest that PCA should be considered a distinct entity from typical AD.
Figures
References
-
- Aharon-Peretz J, Israel O, Goldsher D, Peretz A. Posterior cortical atrophy variants of Alzheimer's disease. Dement Geriatr Cogn Disord. 1999;10(6):483–7. - PubMed
-
- Ashburner J, Friston KJ. Voxel-based morphometry--the methods. Neuroimage. 2000;11(6 Pt 1):805–21. - PubMed
-
- Baron JC, Chetelat G, Desgranges B, Perchey G, Landeau B, de la Sayette V, Eustache F. In vivo mapping of gray matter loss with voxel-based morphometry in mild Alzheimer's disease. Neuroimage. 2001;14(2):298–309. - PubMed
-
- Benson DF, Davis RJ, Snyder BD. Posterior cortical atrophy. Arch Neurol. 1988;45(7):789–93. - PubMed
-
- Bokde AL, Pietrini P, Ibanez V, Furey ML, Alexander GE, Graff-Radford NR, Rapoport SI, Schapiro MB, Horwitz B. The effect of brain atrophy on cerebral hypometabolism in the visual variant of Alzheimer disease. Arch Neurol. 2001;58(3):480–6. - PubMed
Publication types
MeSH terms
Grants and funding
LinkOut - more resources
Full Text Sources
Medical
