. 2006 Aug;141(4):1630-43.
doi: 10.1104/pp.106.082396. Epub 2006 Jun 23.

Natural variation for carbohydrate content in Arabidopsis. Interaction with complex traits dissected by quantitative genetics

Affiliations

Natural variation for carbohydrate content in Arabidopsis. Interaction with complex traits dissected by quantitative genetics

Fanny Calenge et al. Plant Physiol. 2006 Aug.

Abstract

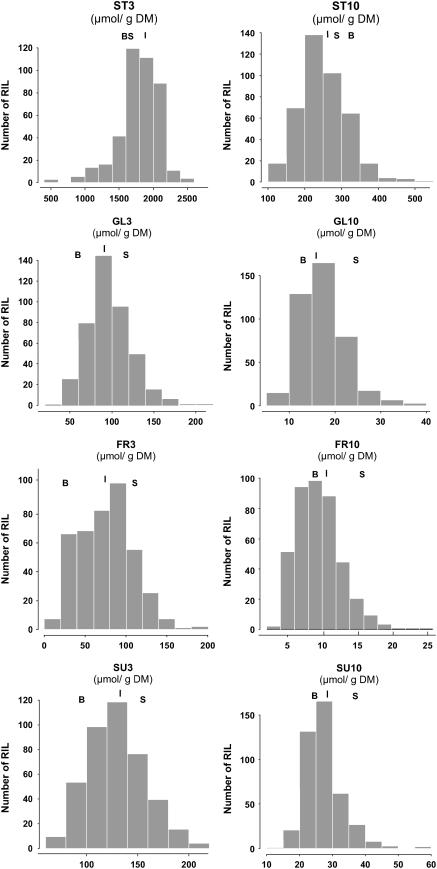
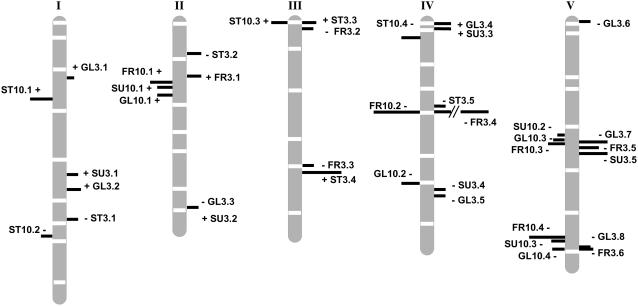
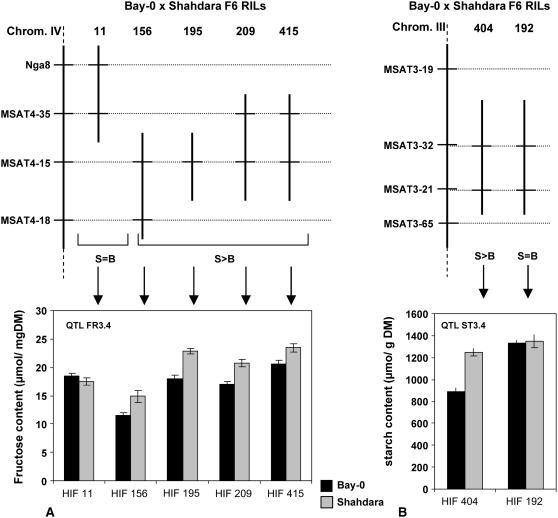
Besides being a metabolic fuel, carbohydrates play important roles in plant growth and development, in stress responses, and as signal molecules. We exploited natural variation in Arabidopsis (Arabidopsis thaliana) to decipher the genetic architecture determining carbohydrate content. A quantitative trait locus (QTL) approach in the Bay-0 x Shahdara progeny grown in two contrasting nitrogen environments led to the identification of 39 QTLs for starch, glucose, fructose, and sucrose contents representing at least 14 distinct polymorphic loci. A major QTL for fructose content (FR3.4) and a QTL for starch content (ST3.4) were confirmed in heterogeneous inbred families. Several genes associated with carbon (C) metabolism colocalize with the identified QTL. QTLs for senescence-related traits, and for flowering time, water status, and nitrogen-related traits, previously detected with the same genetic material, colocalize with C-related QTLs. These colocalizations reflect the complex interactions of C metabolism with other physiological processes. QTL fine-mapping and cloning could thus lead soon to the identification of genes potentially involved in the control of different connected physiological processes.


Figures

Figure 1.
Figure 1.
Histograms of repartition of the phenotypic values in the Bay-0 × Shahdara population. For trait meaning, refer to Table I. B and S positions indicate values obtained for the parental accessions Bay-0 and Shahdara, respectively. The position of the vertical line above bars indicates the population mean value.
Figure 2.
Figure 2.
QTLs detected for starch (ST), Glc (GL), Fru (FR), and Suc (SU) contents in the Bay-0 × Shahdara population. Each QTL is represented by a bar located at its most probable position (likelihood peak). QTLs detected on N+ (respectively, N−) are represented on the left (resp. right) side of chromosomes. The length of the bar is proportional to the QTL contribution to the phenotypic variation in the population (R2). The sign of the allelic effect is indicated for each QTL. The framework genetic map (indicating positions of the microsatellites markers) is from Loudet et al. (2002).
Figure 3.
Figure 3.
Confirmation of QTLs FR3.4 and ST3.4 through NIL comparisons. A, HIFs 209, 415, 195, and 156 segregate around marker MSAT4-15. Comparison of NILs derived from these HIFs and fixed for either the Bay-0 (B) or the Shahdara (S) genotype confirms FR3.4. HIF11 segregates around markers NGA8 and MSAT4.35, and comparison of B/S-fixed NIL derived from this HIF does not confirm this QTL. B, HIF404 segregates around markers MSAT3-32 and MSAT3-21, and B/S-fixed NILs from this HIF confirm QTL ST3.4. Vertical bars indicate ses. S > B (S = B), Phenotypic values of NILs with the Shahdara genotype at the segregating region are (are not) significantly different from NILs with the Bay-0 genotype at the 5% probability threshold. Recombination breakpoints delimiting heterozygous regions are arbitrarily depicted in the middle of the marker interval.

Similar articles

Cited by

References

    1. Alonso-Blanco C, Blankestijn-de Vries H, Hanhart CJ, Koornneef M (1999) Natural allelic variation at seed size loci in relation to other life history traits of Arabidopsis thaliana. Proc Natl Acad Sci USA 96: 4710–4717 - PMC - PubMed
    1. Alonso-Blanco C, El-Assal SE, Coupland G, Koornneef M (1998) Analysis of natural allelic variation at flowering time loci in the Landsberg erecta and Cape Verde Islands ecotypes of Arabidopsis thaliana. Genetics 149: 749–764 - PMC - PubMed
    1. Alonso-Blanco C, Koornneef M (2000) Naturally occurring variation in Arabidopsis: an underexploited resource for plant genetics. Trends Plant Sci 5: 22–29 - PubMed
    1. Arabidopsis Genome Initiative (2000) Analysis of the genome sequence of the flowering plant Arabidopsis thaliana. Nature 408: 796–815 - PubMed
    1. Balibrea Lara ME, Gonzalez Garcia MC, Fatima T, Ehness R, Lee TK, Proels R, Tanner W, Roitsch T (2004) Extracellular invertase is an essential component of cytokinin-mediated delay of senescence. Plant Cell 16: 1276–1287 - PMC - PubMed

Publication types

LinkOut - more resources