Comparative Study
. 2006 Jul;3(7):e232.
doi: 10.1371/journal.pmed.0030232.

Predicting survival within the lung cancer histopathological hierarchy using a multi-scale genomic model of development

Affiliations
Comparative Study

Predicting survival within the lung cancer histopathological hierarchy using a multi-scale genomic model of development

Hongye Liu et al. PLoS Med. 2006 Jul.

Abstract

Background: The histopathologic heterogeneity of lung cancer remains a significant confounding factor in its diagnosis and prognosis-spurring numerous recent efforts to find a molecular classification of the disease that has clinical relevance.

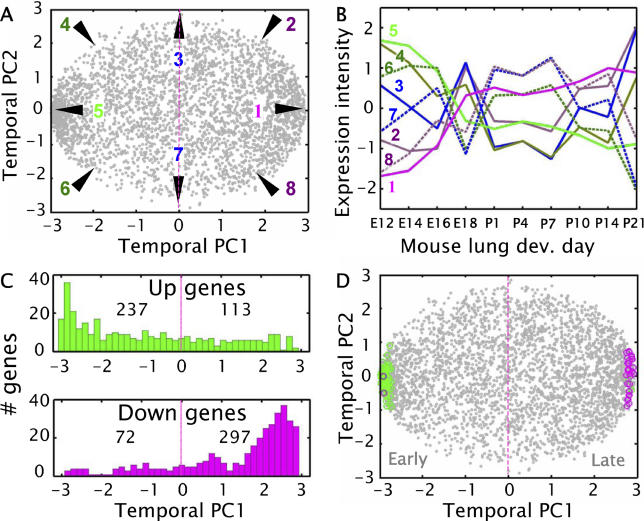
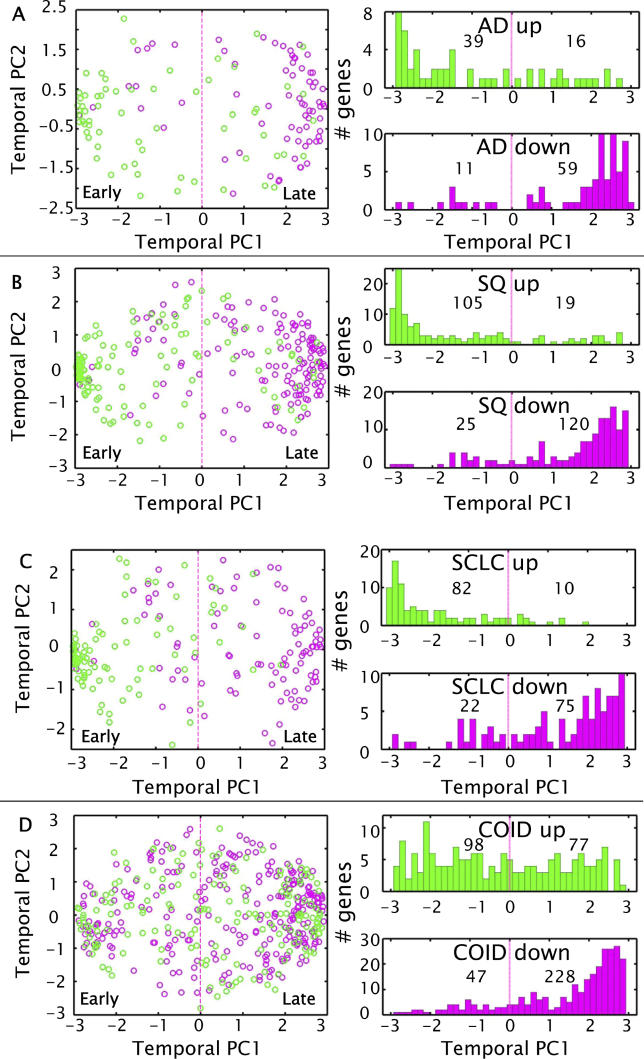
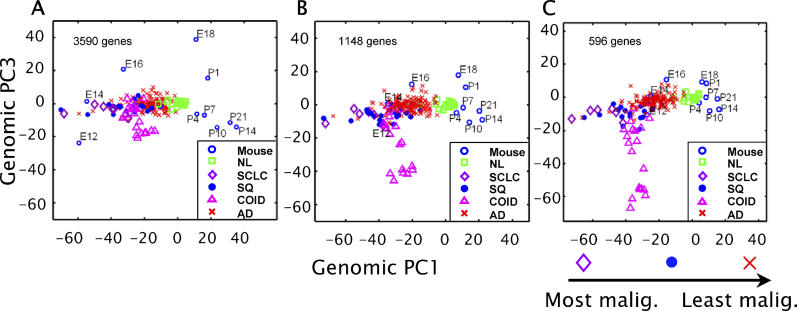
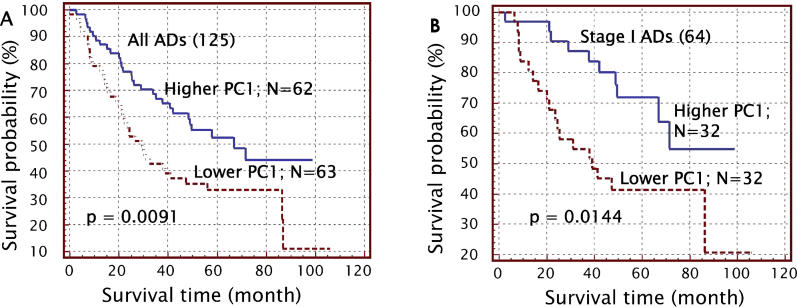
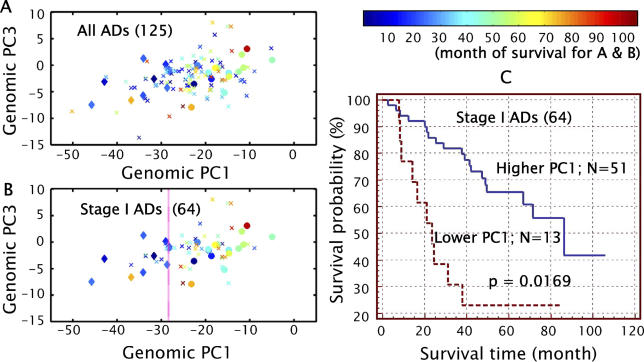
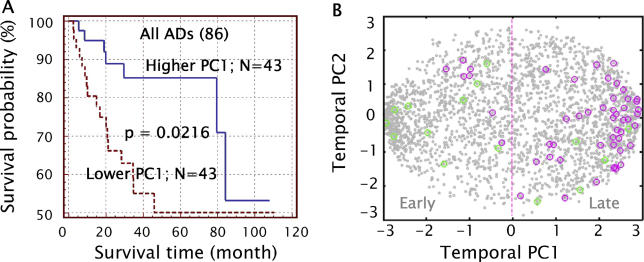
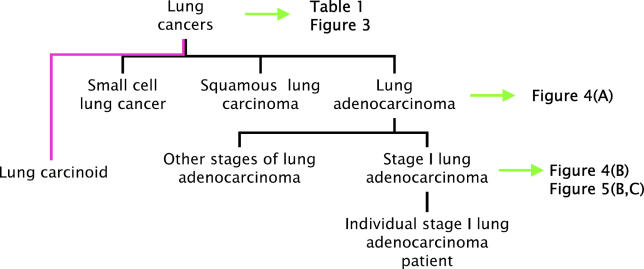
Methods and findings: Molecular profiles of tumors from 186 patients representing four different lung cancer subtypes (and 17 normal lung tissue samples) were compared with a mouse lung development model using principal component analysis in both temporal and genomic domains. An algorithm for the classification of lung cancers using a multi-scale developmental framework was developed. Kaplan-Meier survival analysis was conducted for lung adenocarcinoma patient subgroups identified via their developmental association. We found multi-scale genomic similarities between four human lung cancer subtypes and the developing mouse lung that are prognostically meaningful. Significant association was observed between the localization of human lung cancer cases along the principal mouse lung development trajectory and the corresponding patient survival rate at three distinct levels of classical histopathologic resolution: among different lung cancer subtypes, among patients within the adenocarcinoma subtype, and within the stage I adenocarcinoma subclass. The earlier the genomic association between a human tumor profile and the mouse lung development sequence, the poorer the patient's prognosis. Furthermore, decomposing this principal lung development trajectory identified a gene set that was significantly enriched for pyrimidine metabolism and cell-adhesion functions specific to lung development and oncogenesis.

Conclusions: From a multi-scale disease modeling perspective, the molecular dynamics of murine lung development provide an effective framework that is not only data driven but also informed by the biology of development for elucidating the mechanisms of human lung cancer biology and its clinical outcome.


Conflict of interest statement

Competing Interests: The authors have declared that no competing interests exist.

Figures

Figure 1
Figure 1. Mouse Lung Development Profiles in Temporal PC Representation, and the General Developmental Profile Segregation of Up- and Down-Regulated Genes in Human Lung Cancer
(A) Expression profiles of all 3,590 unique genes during mouse lung development as represented in temporal PC1 and PC2. Each dot marks a gene. (B) Developmental profile examples of genes at the periphery of the disc-like scatter plot in (A) at 45° (π/4 radians starting at “3 o'clock”) rotational intervals. (C) Histograms of the mouse lung temporal PC1 coordinates of the 719 genes 2-fold significantly up- and down-regulated in any one of the four human lung cancer subtypes (χ 2 = 168.338, p < 0.001, OR = 8.652). (D) The profiles of the top 100 genes (68 cancer up-regulated [green circles] and 32 cancer down-regulated [magenta circles]) composing the malignancy signature (see Results) among all 3,590 mouse lung developmental gene profiles. Of the 68 cancer up-regulated genes, all but two are in the late developmental profile hemisphere. Of the 32 cancer down-regulated genes, all but two are in the early developmental profile hemisphere (χ 2 = 82.5185, p < 0.001, OR = 544).
Figure 2
Figure 2. Temporal Analyses of the Significantly Differentiated Lung Cancer Genes in Murine Lung Development
Analysis of mouse lung development profiles of genes 2-fold significantly up- or down-regulated in each of the four human lung cancer subtypes in relation to all 3,590 gene profiles in temporal PC1 and PC2 confirms a developmental association at the gene-by-gene scale. Shown are the mouse lung development profiles of 2-fold significantly up-regulated (green circles) and down-regulated (magenta circles) genes in human lung cancer subtypes relative to NL. (A) Up- and down-regulated genes in AD (χ 2 = 36.83, p < 0.001, OR = 13.074). (B) Up- and down-regulated genes in SQ (χ 2 = 119.036, p < 0.001, OR = 26.526). (C) Up- and down-regulated genes in SCLC (χ 2 = 81.584, p < 0.001, OR = 27.955). (D) Up- and down-regulated genes in lung COID (χ 2 = 72.363, p < 0.001, OR = 6.174).
Figure 3
Figure 3. The Projection of NL and Lung Cancer Genomic Profiles onto the Genomic Mouse Lung Development Frameworks Constructed from Three Different Mouse Gene Subsets
In all cases, genomic PC1 of mouse lung development is positively correlated with lung development time. Mouse lung sample placements (blue circles) are nearly contiguous as a function of their stage of development. The separation between the human lung cancer subtypes in this mouse genomic development framework is defined by a class differentiation measure (see Methods). Table S3 gives the score pca values for the top-union algorithm for these gene set size parameters. Mouse, mouse lung development stages. (A) Human lung samples projected onto the mouse lung development genomic framework (genomic PC1 and PC3) of all 3,590 genes. (B) Same as (A), but for the mouse development framework constructed from the subset of 1,148 significantly differentially expressed genes in the human lung cancer subtypes. (C) Same as (B), but for the mouse development framework constructed from a further subset of 596 genes of the 1,148.
Figure 4
Figure 4. Survival Analyses of AD Patients Based on Lung Development Association
Survival analyses of lung AD patients based on their mouse lung genomic PC1 coordinate show significant survival time differences between samples with early PC1 coordinates versus samples with later PC1 coordinates. The lung development genomic framework is constructed from 472 genes that are significantly up- or down-regulated in AD, SQ, or SCLC subtypes from among the set of 596 significant genes (i.e., excluding COID significant genes). (A) K-M plot for 125 AD patients separated into two quasi-equal-sized groups at the median (50th percentile) by their mouse lung genomic PC1 coordinate ( p = 0.0091). (B) K-M plot for 64 stage I AD patients separated into two equal-sized groups at the median by their mouse lung genomic PC1 coordinates ( p = 0.0144). These 64 stage I AD patient samples are selected for having more than 40% tumor cellularity, no mixed histology (adenosquamous), and patient survival information; the same criteria were described in Beer et al. [ 21].
Figure 5
Figure 5. Survival Analyses of Human Lung AD Subclasses from Bhattacharjee et al. [ 10] Based on Lung Developmental Association
(A) AD samples identified as forming two distinct subclasses C2 and C4 by Bhattacharjee et al. seen from the genomic PC1 and PC3 perspective of the 472-gene mouse lung development framework. Each sample point is color-coded by its survival time. Circles indicate members of class C4, diamonds indicate members of class C2, and “X”s correspond to all other AD samples. (B) Same as in (A), except that here only the stage I AD samples (such samples within C2, C4, and other) are highlighted. The mouse genomic PC1 halfway separation value between the C2 and C4 samples is noted. (C) K-M plot based on 64 stage I AD patients separated into two groups by the mouse PC1 halfway separation value from (B) ( p = 0.0169); the low-survival group has 13 patients and the high-survival group has 51 patients.
Figure 6
Figure 6. Independent Validation with Separate Human Lung AD Dataset from Beer et al. [ 21]
(A) Survival analyses of 86 human lung ADs by K-M plot with patients separated into two groups by the mouse PC1 median point ( p = 0.0216). (B) The profiles of the 91 genes (26 cancer up-regulated [green circles] and 65 cancer down-regulated [magenta circles]) among 2,653 mouse lung developmental gene profiles.
Figure 7
Figure 7. Developmental Association Predicts Human Lung Cancer Survival at Three Distinct Levels of Classical Histopathological Resolution

References

    1. Cancer Research UK. Cancerstats monograph 2004—Cancer incidence, survival and mortality in the UK and EU. London: Cancer Research UK; 2004. 88 pp.
    1. Jemal A, Murray T, Ward E, Samuels A, Tiwari RC, et al. Cancer statistics, 2005. CA Cancer J Clin. 2005;55:10–30. - PubMed
    1. Fry WA, Phillips JL, Menck HR. Ten-year survey of lung cancer treatment and survival in hospitals in the United States: A national cancer data base report. Cancer. 1999;86:1867–1876. - PubMed
    1. Travis WD, Colby TV, Corrin B, Shimosato Y, Brambilla E. Histological typing of lung and pleural tumors, 3rd ed. World Health Organization International Histological Classification of Tumours. New York: Springer; 1999. 156 pp.
    1. Donald W, Kufe M, Raphael E, Pollock M, Ralph R, et al. Cancer medicine, 6th ed. Lewiston (New York): BC Decker; 2003. 2,400 p.

Publication types

MeSH terms