. 2006 Jun 26:7:162.
doi: 10.1186/1471-2164-7-162.

Clustering of Pseudomonas aeruginosa transcriptomes from planktonic cultures, developing and mature biofilms reveals distinct expression profiles

Affiliations

Clustering of Pseudomonas aeruginosa transcriptomes from planktonic cultures, developing and mature biofilms reveals distinct expression profiles

Richard D Waite et al. BMC Genomics. .

Abstract

Background: Pseudomonas aeruginosa is a genetically complex bacterium which can adopt and switch between a free-living or biofilm lifestyle, a versatility that enables it to thrive in many different environments and contributes to its success as a human pathogen.

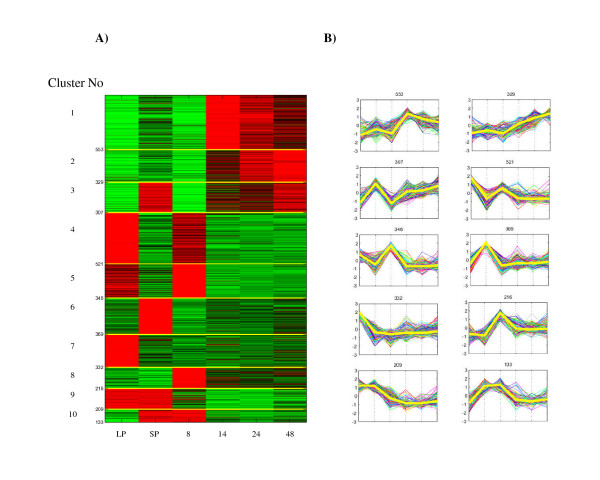
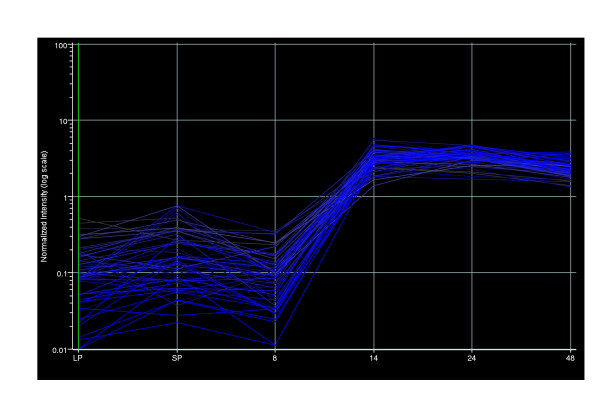
Results: Transcriptomes derived from growth states relevant to the lifestyle of P. aeruginosa were clustered using three different methods (K-means, K-means spectral and hierarchical clustering). The culture conditions used for this study were; biofilms incubated for 8, 14, 24 and 48 hrs, and planktonic culture (logarithmic and stationary phase). This cluster analysis revealed the existence and provided a clear illustration of distinct expression profiles present in the dataset. Moreover, it gave an insight into which genes are up-regulated in planktonic, developing biofilm and confluent biofilm states. In addition, this analysis confirmed the contribution of quorum sensing (QS) and RpoS regulated genes to the biofilm mode of growth, and enabled the identification of a 60.69 Kbp region of the genome associated with stationary phase growth (stationary phase planktonic culture and confluent biofilms).

Conclusion: This is the first study to use clustering to separate a large P. aeruginosa microarray dataset consisting of transcriptomes obtained from diverse conditions relevant to its growth, into different expression profiles. These distinct expression profiles not only reveal novel aspects of P. aeruginosa gene expression but also provide a growth specific transcriptomic reference dataset for the research community.


Figures

Figure 1
Figure 1
Results of K-means clustering of the expression data (K = 10). The three replicates for each of the six conditions were averaged, and then normalized to zero mean and unit variance. A) The Eisen diagram [56] of the expression profiles grouped according to the results of the clustering. Red denotes that the value observed is above the mean of the observation across the dataset. The y-axis shows the number of genes in each cluster. The labels on the X-axis denote the different expression conditions: LP, LP planktonic culture; SP, SP planktonic culture; 8, 14, 24 and 48, biofilm time points. B) The plot of the profiles in each cluster. The X-axis shows the conditions in the same order as A). The thick yellow lines represent the learned cluster centres.
Figure 2
Figure 2
Comparison of microarray and quantitative reverse transcriptase PCR (qRT-PCR) transcription profiles. A) PA0020 (array cluster 8), B) fliE (array cluster 6), C) PA2184 – (array cluster 1), D) PA5555 – (array cluster 4). X-axis labels (expression conditions) – LP, LP planktonic culture; SP, SP planktonic culture; 8, 8 hr biofilm; 48, 48 hr biofilm. Microarray results – unbroken line, qRT-PCR results broken line. For both microarray (average expression value) and qRT-PCR (expression value) results, the value for each condition (SP, 8, and 48) was divided by the value obtained for LP.
Figure 3
Figure 3
Distribution of ten functional classes throughout the clusters created by K-means clustering (K = 10). Percentages were obtained by dividing the number of genes of a functional class in each cluster, by the total number of genes in that functional class. For a representation of all twenty-six functional classes in all ten clusters see Additional File 1 (Figure. S2).
Figure 4
Figure 4
Percentage of a) RpoS and b) QS regulated genes in each cluster. a) Percentage obtained by dividing the number of RpoS activated or RpoS repressed genes in each cluster by the total number of RpoS activated or RpoS repressed genes. b) Percentage obtained by dividing the number of QS activated or QS repressed genes in each cluster by the total number of QS activated or QS repressed genes. Black columns – activated genes; white columns, repressed genes. QS and RpoS regulated genes were identified under planktonic growth conditions [11-13].
Figure 5
Figure 5
Gene expression profile of genome region PA2134-PA2190. X-axis labels – LP, LP planktonic culture; SP, SP planktonic culture; 8, 14, 24 & 48, biofilm time points.

References

    1. Bodey GP, Bolivar R, Fainstein V, Jadeja L. Infections caused by Pseudomonas aeruginosa. Rev Infect Dis. 1983;5:279–313. - PubMed
    1. Costerton JW, Stewart PS, Greenberg EP. Bacterial biofilms: a common cause of persistent infections. Science. 1999;284:1318–1322. doi: 10.1126/science.284.5418.1318. - DOI - PubMed
    1. Drenkard E. Antimicrobial resistance of Pseudomonas aeruginosa biofilms. Microbes Infect. 2003;5:1213–1219. doi: 10.1016/j.micinf.2003.08.009. - DOI - PubMed
    1. Stover CK, Pham XQ, Erwin AL, Mizoguchi SD, Warrener P, Hickey MJ, Brinkman FS, Hufnagle WO, Kowalik DJ, Lagrou M, Garber RL, Goltry L, Tolentino E, Westbrock-Wadman S, Yuan Y, Brody LL, Coulter SN, Folger KR, Kas A, Larbig K, Lim R, Smith K, Spencer D, Wong GK, Wu Z, Paulsen IT, Reizer J, Saier MH, Hancock RE, Lory S, Olson MV. Complete genome sequence of Pseudomonas aeruginosa PA01, an opportunistic pathogen. Nature. 2000;406:959–964. doi: 10.1038/35023079. - DOI - PubMed
    1. Waite RD, Papakonstantinopoulou A, Littler E, Curtis MA. Transcriptome analysis of Pseudomonas aeruginosa growth: comparison of gene expression in planktonic cultures and developing and mature biofilms. J Bacteriol. 2005;187:6571–6576. doi: 10.1128/JB.187.18.6571-6576.2005. - DOI - PMC - PubMed

Publication types

MeSH terms

LinkOut - more resources