. 2006 Jul;128(1):73-87.
doi: 10.1085/jgp.200609507.

Mechanism of the inhibition of Ca2+-activated Cl- currents by phosphorylation in pulmonary arterial smooth muscle cells

Affiliations

Mechanism of the inhibition of Ca2+-activated Cl- currents by phosphorylation in pulmonary arterial smooth muscle cells

Jeff E Angermann et al. J Gen Physiol. 2006 Jul.

Abstract

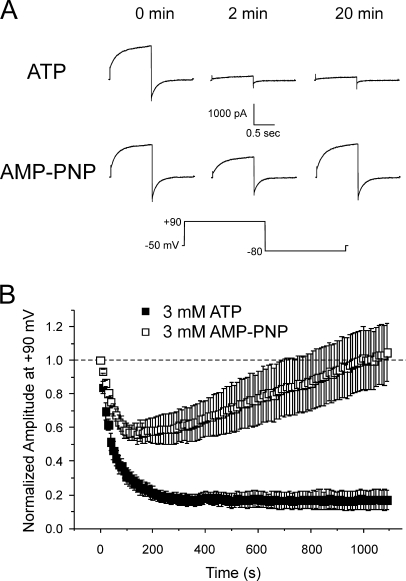
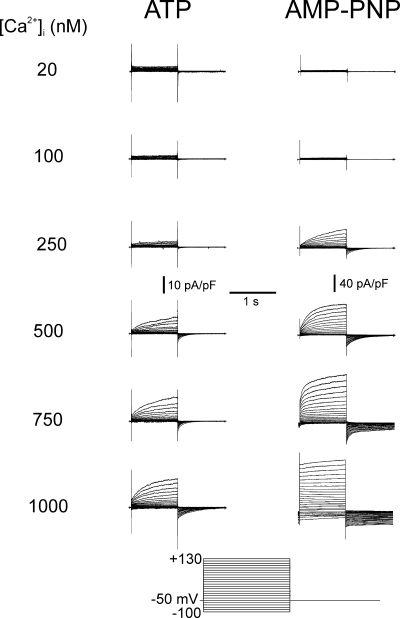
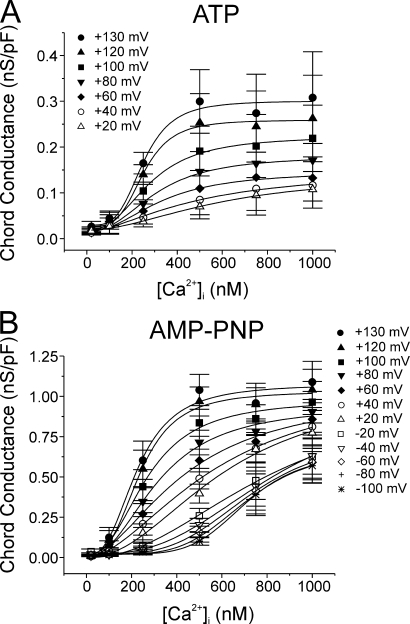
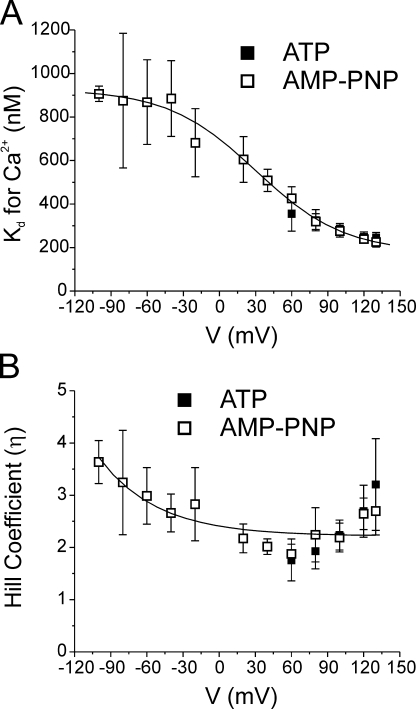
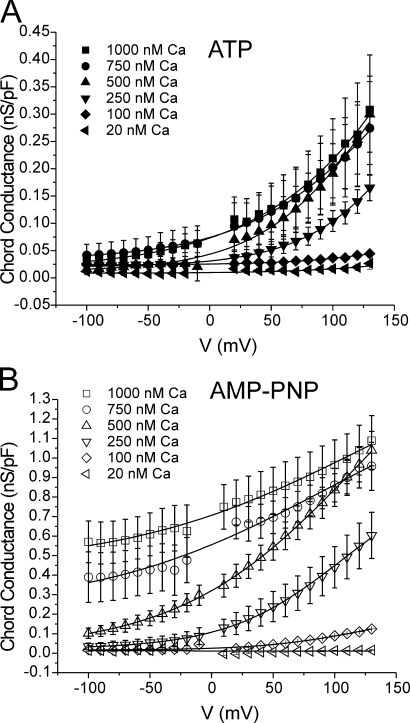
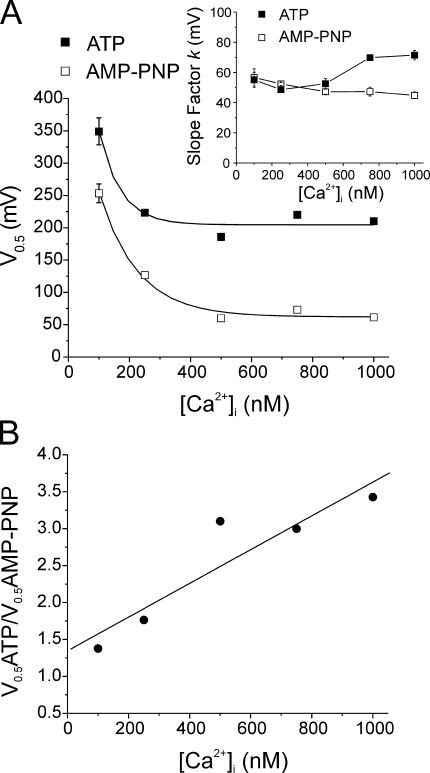
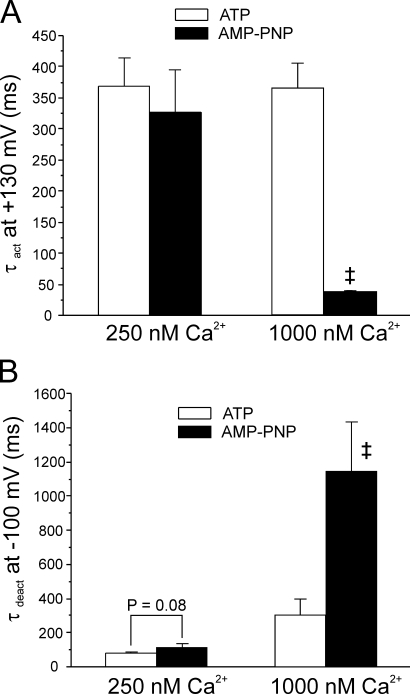
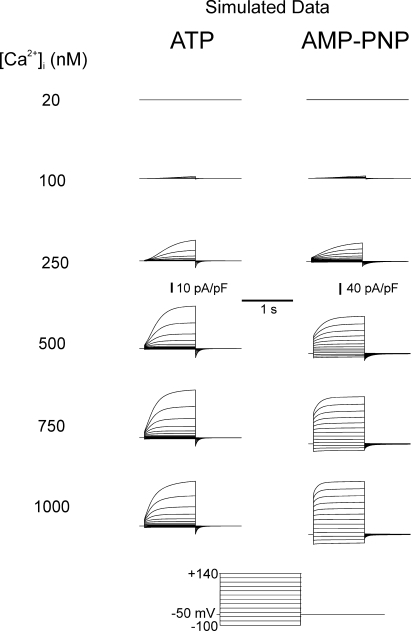
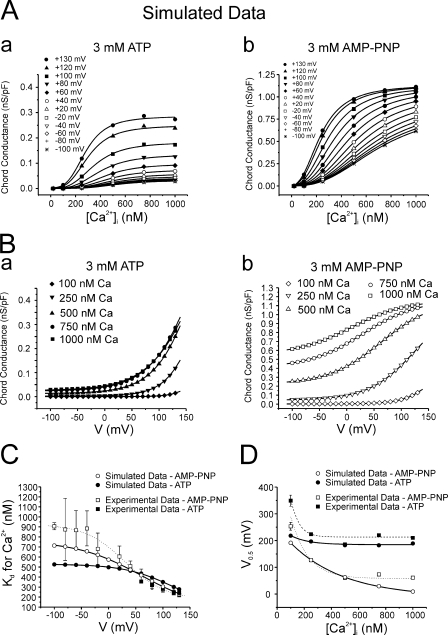
The aim of the present study was to provide a mechanistic insight into how phosphatase activity influences calcium-activated chloride channels in rabbit pulmonary artery myocytes. Calcium-dependent Cl- currents (I(ClCa)) were evoked by pipette solutions containing concentrations between 20 and 1000 nM Ca2+ and the calcium and voltage dependence was determined. Under control conditions with pipette solutions containing ATP and 500 nM Ca2+, I(ClCa) was evoked immediately upon membrane rupture but then exhibited marked rundown to approximately 20% of initial values. In contrast, when phosphorylation was prohibited by using pipette solutions containing adenosine 5'-(beta,gamma-imido)-triphosphate (AMP-PNP) or with ATP omitted, the rundown was severely impaired, and after 20 min dialysis, I(ClCa) was approximately 100% of initial levels. I(ClCa) recorded with AMP-PNP-containing pipette solutions were significantly larger than control currents and had faster kinetics at positive potentials and slower deactivation kinetics at negative potentials. The marked increase in I(ClCa) was due to a negative shift in the voltage dependence of activation and not due to an increase in the apparent binding affinity for Ca2+. Mathematical simulations were carried out based on gating schemes involving voltage-independent binding of three Ca2+, each binding step resulting in channel opening at fixed calcium but progressively greater "on" rates, and voltage-dependent closing steps ("off" rates). Our model reproduced well the Ca2+ and voltage dependence of I(ClCa) as well as its kinetic properties. The impact of global phosphorylation could be well mimicked by alterations in the magnitude, voltage dependence, and state of the gating variable of the channel closure rates. These data reveal that the phosphorylation status of the Ca2+-activated Cl- channel complex influences current generation dramatically through one or more critical voltage-dependent steps.


Figures

Figure 1.
Figure 1.
Attenuation of rundown of Ca2+-activated Cl current in rabbit pulmonary artery myocytes by intracellular dialysis with a nonhydrolyzable form of ATP, AMP-PNP. (A) Representative current traces from typical experiments showing the time-dependent changes of Ca2+-activated Cl current recorded from pulmonary arterial smooth muscle cells dialyzed with 500 nM Ca2+ and 3 mM ATP (first row) or 3 mM AMP-PNP (second row). Currents recorded immediately after breaking the seal (0 min), and after 2 and 20 min of cell dialysis were elicited by repetitive steps (every 10 s) to +90 mV lasting 1 s from a holding potential (HP) of −50 mV . Each depolarizing pulse to +90 mV was followed by a repolarizing step to −80 mV to enhance the magnitude of the tail current. The voltage clamp protocol is shown below the traces. (B) Similar to the experiments depicted in A, this graph shows the mean time course of changes of normalized IClCa amplitude elicited by 1-s depolarizing pulses to +90 mV, followed by 1-s repolarizing steps to −80 mV, in the presence of 3 mM ATP (filled squares; n = 5) or 3 mM AMP-PNP (empty squares; n = 6); each step was applied from HP = −50 mV at a frequency of one pulse every 10 s for 20 min. Please note the attenuation of rundown of IClCa and the delayed recovery of this current in cells dialyzed with AMP-PNP.
Figure 2.
Figure 2.
General properties of Ca2+-activated Cl currents recorded from cells dialyzed with distinct free Ca2+ concentrations in the presence of ATP or AMP-PNP. Typical families of IClCa recorded with pipette solutions containing 20, 100, 250, 500, 750, or 1000 nM Ca2+, with either 3 mM ATP (left) or 3 mM AMP-PNP (right). All families of currents were evoked by the protocol shown at bottom. Notice the different vertical calibration bars for the traces recorded with ATP and AMP-PNP. Besides being much larger in cells dialyzed with AMP-PNP versus ATP, IClCa activated more quickly and deactivated more slowly with AMP-PNP. All traces were obtained after 20 min of cell dialysis.
Figure 3.
Figure 3.
Calcium dependence of IClCa at different membrane potentials recorded after prolonged cell dialysis with ATP or AMP-PNP. For the experiments conducted with ATP (A; n = 3–13) and AMP-PNP (B; n = 5–16), all data from experiments identical to those described in Fig. 2 were pooled and the mean chord conductance ± SEM (calculated using Eq. 1 in the Materials and Methods) at each step potential plotted as a function of pipette Ca2+ concentration ranging from 20 to 1000 nM Ca2+. Data at many potentials were purposely omitted for the sake of clarity but values extracted from such potentials are represented in Fig. 4. Each data set was fitted with the Hill equation (Eq. 1 in Materials and Methods) for determination of the Ca2+ affinity and Hill coefficient at a given step potential, which are described in Fig. 4. In A, the Ca2+ dependence of the chord conductance measured with ATP at potentials negative to 0 mV could not be fitted due to the small and variable magnitude of the macroscopic IClCa recorded in the negative range of membrane potentials. All plots were generated from data obtained after 20 min of cell dialysis with either nucleotide.
Figure 4.
Figure 4.
The Ca2+ sensitivity and number of Ca2+ ions required for activation of IClCa are not influenced by the global state of phosphorylation. (A) Graph showing the voltage dependence of the Ca2+ affinity of IClCa (apparent Kd for Ca2+) derived from experiments obtained with 3 mM ATP (filled squares) or 3 mM AMP-PNP (empty squares). Mean Kd ± fitting error (error scaled to the square root of reduced χ2 as calculated by Origin software) for Ca2+ at each voltage was estimated from curve fitting of the data to the Hill equation as represented in Fig. 3. The line passing through the data points is a Boltzmann fit to the data points and is described by the following parameters: Kd for Ca2+ = {748.1/ [1 + exp((V − 30.3)/36.7)]} + 178.42, where V is membrane potential. (B) Graph illustrating the voltage dependence of the Hill or cooperativity coefficient (η) obtained from analysis of the Ca2+ dependence of IClCa with the Hill equation (Fig. 3) after 20 min of cell dialysis with ATP (filled squares) or AMP-PNP (empty squares). The solid line is a single exponential least-square fit to the data and is described by the following formula: η = 0.19 * exp(−V/48.3) + 2.22, where V is membrane potential. All plots were generated from data obtained after 20 min of cell dialysis with either nucleotide.
Figure 5.
Figure 5.
Voltage dependence of IClCa analyzed after prolonged dialysis with ATP and AMP-PNP. The same data from the experiments described in Fig. 2 were used to construct the voltage dependence of IClCa for each pipette Ca2+ concentration ranging from 100 to 1000 nM in the presence of 3 mM ATP (A) or AMP-PNP (B). The two graphs shown in A and B report the mean ± SEM chord conductance of fully activated IClCa as a function of step potential ranging from −100 to +130 mV. Data points at or around 0 mV were not included due to the small current near the equilibrium potential for Cl. All lines are least-square Boltzmann fits to the data (Eq. 2) from which we extracted the half-maximal voltage (V 0.5), which are reported in Fig. 6. All sigmoidal relationships in the two panels were fitted by constraining each fit to a maximal conductance of 1.16 nS/pF; the latter value is the mean of the maximal conductance estimated from curve fitting of the data obtained with 500, 750, and 1000 nM Ca2+ and AMP-PNP, which yielded similar estimates. Mean data points in A and B are reproduced from Fig. 3 but plotted differently. All plots were generated from data obtained after 20 min of cell dialysis with either nucleotide.
Figure 6.
Figure 6.
A reduction in the global state of phosphorylation by cell dialysis with AMP-PNP causes a pronounced shift of the voltage dependence of IClCa toward negative potentials. (A) From the experiments conducted with pipette solutions containing ATP (filled squares) or AMP-PNP (empty squares), the mean ± fitting error (error scaled to the square-root of reduced χ2 as calculated by Origin software) of half-maximal activation voltages (V 0.5) determined from the analyses outlined in Fig. 5 (Eq. 2) were plotted as a function of internal Ca2+ concentration ([Ca2+]). The lines passing through the data points are least-square exponential fits to the data points and are described by the following formulas: ATP, V 0.5 = 608.8 * exp(−[Ca2+]/69.2) + 205.5; AMP-PNP, V 0.5 = 482.3 * exp(−[Ca2+]/119) + 66.1. Inset, graph illustrating the Ca2+ dependence of the slope factor k extracted from analysis of the voltage dependence of the conductance of IClCa (Fig. 5) measured with ATP (filled squares) and AMP-PNP (empty squares). As for V 0.5, each data point is mean ± fitting error (error scaled to the square-root of reduced χ2 as calculated by Origin software) of the k value determined for each data set. (B) In this graph, the ratio of the mean half-maximal voltage obtained in ATP over that in AMP-PNP (V 0.5ATP/V 0.5AMP-PNP; derived from A) was plotted as a function of pipette Ca2+ concentration ([Ca2+]i). The slope of the linear regression passing through the calculated data points is significantly different from 0, with P = 0.025. The parameters of the equation determining this regression are: V 0.5ATP/V 0.5AMP-PNP = 0.0023 * [Ca2+]i + 1.35 (r2 = 0.852). All plots were generated from data obtained after 20 min of cell dialysis with either nucleotide.
Figure 7.
Figure 7.
Ca2+ dependence of IClCa kinetics recorded from ATP- and AMP-PNP–loaded myocytes. (A and B) Bar graphs summarizing the effects of cell dialysis with 3 mM ATP (open bars) or 3 mM AMP-PNP (filled bars) on the time constant of activation at +130 mV (τact; A) and deactivation at −100 mV (τdeact; B) of IClCa elicited with either 250 or 1000 nM Ca2+ in the pipette solution. Please note in B that τdeact measured in AMP-PNP and 1000 nM Ca2+ is the slower of the two time constants of deactivation estimated by least-squares biexponential fitting. For both panels, each bar represents a mean ± SEM of four to five measurements. Two-way ANOVA tests were used to assess statistical significance between mean data obtained in ATP and AMP-PNP; with 1000 nM Ca2+, mean τact (A) and τdeact (B) in ATP were significantly different from those estimated with AMP-PNP (, P < 0.001, determined with LSD post-hoc test). Both bar graphs were generated from data obtained after 20 min of cell dialysis with either nucleotide. A more thorough analysis of the effects of the two nucleotides on IClCa kinetics can be found in the online supplemental material.
Figure 8.
Figure 8.
Modeling of IClCa under conditions simulating prolonged cell dialysis with ATP or AMP-PNP. The nomenclature of this figure is identical to that of actual data shown in Fig. 2 except that the last potential of the voltage clamp protocol was +140 mV instead of +130 mV, and voltage steps were incremented by +20 mV from −100 mV. The conditions and parameters used for the simulation are described in the text (Materials and Methods and Results) and Table I. Again, note the different calibration bars for the simulations with ATP and AMP-PNP.
Figure 9.
Figure 9.
Comparison of experimental and simulated IClCa data. (A) Plots of simulated chord conductance vs. [Ca2+]i relationships derived from analysis of data generated with the ATP (a) and AMP-PNP (b) models at potentials ranging from −100 to +130 mV (HP = −50 mV), as indicated by the different symbols. All solid lines are fits of the simulated sets of data to the Hill equation (Eq. 1) calculated by Origin software. Parameters calculated from such fits are presented in C. Please note the remarkable similarity between such graphs and those represented in Fig. 3. (B) Plots of simulated chord conductance vs. voltage relationships derived from analysis of data generated with the ATP (a) and AMP-PNP (b) models at [Ca2+]i ranging from 100 to 1000 nM Ca2+ as indicated by the different symbols. All solid lines are fits of the simulated sets of data to the Boltzmann equation (Eq. 2) calculated by Origin software. Parameters calculated from such fits are presented in D. Again, note the high similarity between these relationships and those derived from the experimental results described in Fig. 5. (C) Graph showing the relationship between estimated EC50 for Ca2+ and step potential for experimental (squares) and simulated (circles) data obtained with ATP (filled symbols) and AMP-PNP (empty symbols). The two experimental data sets (ATP and AMP-PNP) and the fit (dotted line; AMP-PNP) are reproduced from Fig. 4 for comparison. The solid lines passing through the two sets of simulated data are Boltzmann fits (Eq. 2) described by the following formulas: ATP, EC50 for Ca2+ = {443.07/[1 + exp((V − 118)/44.6)]} + 85.4; AMP-PNP: EC50 for Ca2+ = {686.4/[1 + exp((V − 59.5)/58.8)]} + 74.7, where V is membrane potential. (D) Graph showing the relationship between the half-maximal activation voltage (V0.5) estimated and internal Ca2+ concentration ([Ca2+]i) for experimental (squares) and simulated (circles) data obtained with ATP (filled symbols) and AMP-PNP (empty symbols). The two experimental data sets and associated fits (dashed and dotted lines) are reproduced from Fig. 6 for comparison. The solid lines passing through the two sets of simulated data are single exponential fits (Eq. 3) described by the following formulas: ATP, V 0.5 = 260.2 * exp(−[Ca2+]i/398.4) − 11.4; AMP-PNP, V 0.5 = 73.5 * exp(−[Ca2+]i/128.8) + 184.5.

Similar articles

Cited by

References

    1. Arreola, J., J.E. Melvin, and T. Begenisich. 1996. Activation of calcium-dependent chloride channels in rat parotid acinar cells. J. Gen. Physiol. 108:35–47. - PMC - PubMed
    1. Boese, S.H., O. Aziz, N.L. Simmons, and M.A. Gray. 2004. Kinetics and regulation of a Ca2+-activated Cl− conductance in mouse renal inner medullary collecting duct cells. Am. J. Physiol. Renal Physiol. 286:F682–F692. - PubMed
    1. Boton, R., D. Singer, and N. Dascal. 1990. Inactivation of calcium-activated chloride conductance in Xenopus oocytes−roles of calcium and protein kinase C. Pflugers Arch. 416:1–6. - PubMed
    1. Britton, F.C., S. Ohya, B. Horowitz, and I.A. Greenwood. 2002. Comparison of the properties of CLCA1 generated currents and ICl(Ca) in murine portal vein smooth muscle cells. J. Physiol. 539:107–117. - PMC - PubMed
    1. Chipperfield, A.R., and A.A. Harper. 2000. Chloride in smooth muscle. Prog. Biophys. Mol. Biol. 74:175–221. - PubMed

Publication types

MeSH terms