. 2006 Jul;128(1):103-18.
doi: 10.1085/jgp.200609505.

Palytoxin-induced effects on partial reactions of the Na,K-ATPase

Affiliations

Palytoxin-induced effects on partial reactions of the Na,K-ATPase

Nadine Harmel et al. J Gen Physiol. 2006 Jul.

Abstract

The interaction of palytoxin with the Na,K-ATPase was studied by the electrochromic styryl dye RH421, which monitors the amount of ions in the membrane domain of the pump. The toxin affected the pump function in the state P-E2, independently of the type of phosphorylation (ATP or inorganic phosphate). The palytoxin-induced modification of the protein consisted of two steps: toxin binding and a subsequent conformational change into a transmembrane ion channel. At 20 degrees C, the rate-limiting reaction had a forward rate constant of 10(5) M(-1)s(-1) and a backward rate constant of about 10(-3) s(-1). In the palytoxin-modified state, the binding affinity for Na+ and H+ was increased and reached values between those obtained in the E1 and P-E2 conformation under physiological conditions. Even under saturating palytoxin concentrations, the ATPase activity was not completely inhibited. In the Na/K mode, approximately 50% of the enzyme remained active in the average, and in the Na-only mode 25%. The experimental findings indicate that an additional exit from the inhibited state exists. An obvious reaction pathway is a slow dephosphorylation of the palytoxin-inhibited state with a time constant of approximately 100 s. Analysis of the effect of blockers of the extracellular and cytoplasmic access channels, TPA+ and Br2-Titu3+, respectively, showed that both access channels are part of the ion pathway in the palytoxin-modified protein. All experiments can be explained by an extension of the Post-Albers cycle, in which three additional states were added that branch off in the P-E2 state and lead to states in which the open-channel conformation is introduced and returns into the pump cycle in the occluded E2 state. The previously suggested molecular model for the channel state of the Na,K-ATPase as a conformation in which both gates between binding sites and aqueous phases are simultaneously in their open state is supported by this study.


Figures
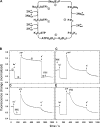
Figure 1.
Figure 1.
Standard experiments with addition of 100 nM PTX at four defined states of the Na,K-ATPase. (A) Post-Albers cycle of the Na,K-ATPase under physiological conditions. E1 and E2 are conformations of the ion pump with ion binding sites facing the cytoplasm and extracellular medium, respectively. Three Na+ and two K+ are transported out of and into the cytoplasm of the cell, respectively. (Na3)E1-P, E2(K2), and ATP·E2(K2) are occluded states in which the ions bound are unable to exchange with either aqueous phases. In the absence of Na+ and K+, the E1 state is actually a H2E1 state (Apell and Diller, 2002). The pump states numbered 1–4 in the scheme of A can be stabilized by appropriate substrate additions, as shown in B except that no ATP was present in the beginning of the experiments shown in B–E and that, therefore, states 1 and 2 did not carry ATP. When all substrates are present, the pump will run through the cycle and most of the pumps are accumulated in the states before the two rate-limiting steps, labeled by “4.” In B–E, the initial state is always H2E1, with the normalized fluorescence level ΔF/F0 = 0. Subsequently, 50 mM NaCl, 0.5 mM ATP, and 20 mM KCl were added, which stabilize the states listed in A. PTX was added at different states of the protein, as indicated by an arrow: (B) Na3E1-P + ATP·E2(K2), (C) H2E1, (D) Na3E1, (E) P-E2.
Figure 2.
Figure 2.
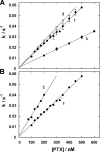
Kinetics of the PTX-induced transition from P-E2 into the toxin-modified state,formula image. The fluorescence decrease upon addition of PTX as shown in Fig. 1 E could be perfectly fitted by a single exponential function, ΔF·exp(−kt). The rate constant k was determined for PTX concentrations between 100 and 600 nM for different Na,K-ATPase preparations and PTX sources. (A) PTX from P. caribaeorum (1 and 2) and two different preparations from rabbit kidney, (3) PTX from P. tuberculosa and the same enzyme as in trace 1. (B) PTX from P. caribaeorum, (1) rabbit kidney Na,K-ATPase and (2) duck salt gland Na,K-ATPase.
Figure 3.
Figure 3.
Effect of PTX on the P-E2 state of the Na,K-ATPase. After the Na,K-ATPase was equilibrated in standard buffer at 20°C, the fluorescence level, F0, represents the state H2E1. Addition of NaCl (50 mM) induced the transition to Na3E1 and the subsequent addition of ATP (1 μM) led to enzyme phosphorylation, transition into the P-E2 conformation, and release of the Na+ ions bound. Due to the fact that the amount of ATP present was so small, within ∼100 s, all ATP was hydrolyzed and all pumps returned into the equilibrium state, Na3E1, under this buffer condition. Then 50 nM PTX was added as well as another 1 μM ATP. In the presence of PTX, the time course of the fluorescence signal was slightly modified. Repetitive additions of 50 nM PTX and 1 μM ATP up to a final PTX concentration of 200 nM led to a distinct fluorescence pattern with an intermediate fluorescence level, which corresponded approximately to the level of the ion pump with two monovalent cations bound. After each reaction sequence, however, the final equilibrium state was Na3E1.
Figure 4.
Figure 4.
Dependence of the PTX-modified state of the Na,K-ATPase on the Na+ concentration in the buffer. The NaCl concentrations were 5 mM (a), 10 mM (b), 15 mM (c), 20 mM (d), 25 mM (e). The final fluorescence level represents state Na3E1 in all experiments and it was achieved faster the higher the Na+ concentration was. The time, Δt r, at which the fluorescence level returned halfway from the intermediate PTX-inhibited level to the final level is indicated by diamonds. The reciprocal value, 1/Δt r, is plotted in the inset against the respective Na+ concentration in the buffer. The data points were fitted with Eq. 2 as described in the text.
Figure 5.
Figure 5.
Temperature dependence of the PTX-induced transition from P-E2 into the toxin-modified state. The fluorescence decrease upon PTX addition was measured at various temperatures between 5°C and 38°C, and fitted by a single exponential function, ΔF·exp(−kt). The rate constant, k, was plotted against the temperature in form of an Arrhenius plot. The data show different temperature dependences below and above 23°C (1/T = 3.378 × 10⁻³ K−1). The dashed lines through the data represent (1) 71 kJ/mol and (2) 28.5 kJ/mol.
Figure 6.
Figure 6.
Effect of PTX on the enzyme activity of the Na,K-ATPase. The ATP-hydrolyzing activity was measured with the standard PK/LDH assay and set to 100% in the absence of PTX. The inhibiting action of PTX was studied in buffer containing 100 mM Na+ and 10 mM K+ (a, Na,K-mode) or in 110 mM Na+ (b, Na-only mode). In the Na,K mode, no difference was found in enzyme from rabbit kidney (solid circles) and duck salt gland (open squares). In the presence of 10 mM K+, a significantly lower level of inhibition was observed. When the data were fitted by a single binding isotherm (solid lines), the fraction of inhibition at saturating PTX was 52% in the Na,K mode and 75% in the Na-only mode.
Figure 7.
Figure 7.
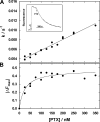
Modification of the Na,K-ATPase by PTX under the condition of backdoor phosphorylation. When 0.5 mM inorganic phosphate (Pi) is added to the Na,K-ATPase in the absence of Na+ and K+ ions, the following reaction sequence is triggered: (H2E1→)E2(H2)→P-E2H2→P-E2 (Apell and Diller, 2002), and the dissociation of the two protons leads to an increase of the RH421 fluorescence as shown in the inset of A. Addition of 100 nM PTX produced an exponential decay of the fluorescence intensity whose rate constant, k, and fluorescence amplitude, ΔFmax, was determined. When plotted as function of the applied PTX concentration (A), a linear dependence of k on PTX concentration was found from which k bind = 0.22 × 10⁵ M−1s−1 and k diss = 35 × 10−4 s−1 were determined. (B) The concentration dependence of ΔFmax could be fitted by a binding isotherm with a half-saturating binding concentration of K m = 25.8 nM.
Figure 8.
Figure 8.
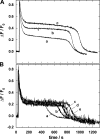
Effect of access-channel blockers on the PTX-induced action of the Na,K-ATPase. Na,K-ATPase was equilibrated in standard buffer: 200 nM RH421, 50 mM NaCl, and PTX. Upon addition of 1 μM ATP, the enzyme turned over into the P-E2 state to allow PTX (200 nM in [A] and 100 nM [B]) to modify the pump. (A) In the absence (a) or in the presence of 10 mM (b) and 20 mM (c) TPA+, the main difference of the ATP-induced fluorescence signal was an enhanced intermediate fluorescence level in the presence of the channel blocker. (B) In the absence (a) or in the presence of 5 μM (b), 10 μM (c), 15 μM (d), and 20 μM (e) Br2-Titu3+, the only significant difference was the duration of the intermediate, PTX-dependent state, which was elongated by the presence of Br2-Titu3+.
Figure 9.
Figure 9.
Effect of access-channel blockers on the PTX-induced action of the Na,K-ATPase in the absence of monovalent cations other than H+. Na,K-ATPase was phosphorylated in standard buffer by 0.5 mM Tris phosphate in the absence or presence of 15 μM Br2-Titu3+ and/or 30 mM TPA+. After reaching a steady-state level of the fluorescence, corresponding to state P-E2, 150 nM PTX was added. Only Br2-Titu3+, the blocker of the cytoplasmic access channel, produced a striking difference by reducing the amplitude of the fluorescence decrease by about a factor of five. TPA+ had no significant effect. In all four cases, the rate constant of the exponential decay was 0.01 ± 0.0002 s−1.
Figure 10.
Figure 10.
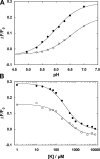
Effect of Br2-Titu3+ on H+ and K+ binding to the Na,K-ATPase in the PTX-modified state (150 nM PTX). Titration of the binding sites was studied in the absence (open circles) and presence of 15 μM Br2-Titu3+ (solid circles). (A) The pH titration showed that in the presence of Br2-Titu3+, the pK was shifted by 0.5 pH units to a lower value, indicating a repulsive effect of the positively charged channel blocker on H+ binding. Merging of the data at low pH represents a saturation of ion binding with both binding sites in the Na,K-ATPase to be saturated. (B) In the case of high-affinity K+ binding, the half-saturating K+ concentration was identical under both conditions (∼300 μM), and saturation at high concentration was also found for both conditions to be the same state with two ions bound. The difference of the initial fluorescence level was caused by the varying H+ binding at pH 7.
Figure 11.
Figure 11.
Proposal for an extended Post-Albers pump cycle of the Na,K-ATPase induced by the effect PTX. Due to the weak ion selectivity of the PTX-modified ion pump, the ions bound can be Na+, K+, and H+. Therefore, “X” denotes that different ions are transported under appropriate buffer composition from the extracellular side to the cytoplasm. (In the case of H+, the indicated exchange of two X+ against two H+ in the E1 state is unnecessary.) The underlined states, formula image and formula image, represent the channel-like states of the Na,K-ATPase. The missing left parenthesis in the state formula image shall indicate that the cytoplasmic gate of the Na,K-ATPase is still held in its open position.

Similar articles

Cited by

References

    1. Apell, H.J. 2004. How do P-type ATPases transport ions? Bioelectrochemistry. 63:149–156. - PubMed
    1. Apell, H.-J. 2003. Toward an understanding of ion transport through the Na,K-ATPase. Ann. N. Y. Acad. Sci. 986:133–140. - PubMed
    1. Apell, H.-J., and A. Diller. 2002. Do H+ ions obscure electrogenic Na+ and K+ binding in the E1 state of the Na,K-ATPase? FEBS Lett. 532:198–202. - PubMed
    1. Apell, H.-J., M. Roudna, J.E. Corrie, and D.R. Trentham. 1996. Kinetics of the phosphorylation of Na,K-ATPase by inorganic phosphate detected by a fluorescence method. Biochemistry. 35:10922–10930. - PubMed
    1. Artigas, P., and D.C. Gadsby. 2003. a. Ion occlusion/deocclusion partial reactions in individual palytoxin-modified Na/K pumps. Ann. N. Y. Acad. Sci. 986:116–126. - PubMed

Publication types

MeSH terms