Essential role of membrane cholesterol in accelerated BCR internalization and uncoupling from NF-kappa B in B cell clonal anergy
- PMID: 16801401
- PMCID: PMC2118358
- DOI: 10.1084/jem.20060552
Essential role of membrane cholesterol in accelerated BCR internalization and uncoupling from NF-kappa B in B cell clonal anergy
Abstract
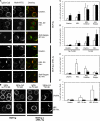
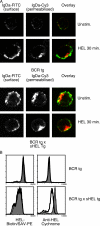
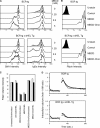
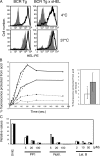
Divergent hypotheses exist to explain how signaling by the B cell receptor (BCR) is initiated after antigen binding and how it is qualitatively altered in anergic B cells to selectively uncouple from nuclear factor kappaB and c-Jun N-terminal kinase pathways while continuing to activate extracellular signal-regulated kinase and calcium-nuclear factor of activated T cell pathways. Here we find that BCRs on anergic cells are endocytosed at a very enhanced rate upon binding antigen, resulting in a large steady-state pool of intracellularly sequestered receptors that appear to be continuously cycling between surface and intracellular compartments. This endocytic mechanism is exquisitely sensitive to the lowering of plasma membrane cholesterol by methyl-beta-cyclodextrin, and, when blocked in this way, the sequestered BCRs return to the cell surface and RelA nuclear accumulation is stimulated. In contrast, when plasma membrane cholesterol is lowered and GM1 sphingolipid markers of membrane rafts are depleted in naive B cells, this does not diminish BCR signaling to calcium or RelA. These results provide a possible explanation for the signaling changes in clonal anergy and indicate that a chief function of membrane cholesterol in B cells is not to initiate BCR signaling, but instead to terminate a subset of signals by rapid receptor internalization.
Figures


Similar articles
-
Maintenance of B cell anergy requires constant antigen receptor occupancy and signaling.Nat Immunol. 2005 Nov;6(11):1160-7. doi: 10.1038/ni1256. Epub 2005 Oct 2. Nat Immunol. 2005. PMID: 16200069
-
Enhancement and suppression of signaling by the conserved tail of IgG memory-type B cell antigen receptors.J Exp Med. 2007 Apr 16;204(4):759-69. doi: 10.1084/jem.20061923. Epub 2007 Apr 9. J Exp Med. 2007. PMID: 17420266 Free PMC article.
-
Disruption of membrane cholesterol stimulates MyD88-dependent NF-kappaB activation in immature B cells.Cell Immunol. 2004 May;229(1):68-77. doi: 10.1016/j.cellimm.2004.06.004. Cell Immunol. 2004. PMID: 15331330
-
Silencing of autoreactive B cells by anergy: a fresh perspective.Curr Opin Immunol. 2006 Jun;18(3):292-7. doi: 10.1016/j.coi.2006.03.015. Epub 2006 Apr 17. Curr Opin Immunol. 2006. PMID: 16616480 Review.
-
Intravenous immunoglobulin induces a functional silencing program similar to anergy in human B cells.J Allergy Clin Immunol. 2014 Jan;133(1):181-8.e1-9. doi: 10.1016/j.jaci.2013.08.042. Epub 2013 Oct 17. J Allergy Clin Immunol. 2014. PMID: 24139609 Review.
Cited by
-
Modulation of the Cellular microRNA Landscape: Contribution to the Protective Effects of High-Density Lipoproteins (HDL).Biology (Basel). 2023 Sep 13;12(9):1232. doi: 10.3390/biology12091232. Biology (Basel). 2023. PMID: 37759631 Free PMC article. Review.
-
Endocytic sequestration of the B cell antigen receptor and toll-like receptor 9 in anergic cells.Proc Natl Acad Sci U S A. 2009 Apr 14;106(15):6262-7. doi: 10.1073/pnas.0812922106. Epub 2009 Mar 30. Proc Natl Acad Sci U S A. 2009. PMID: 19332776 Free PMC article.
-
The outcome of B-cell receptor signaling in chronic lymphocytic leukemia: proliferation or anergy.Haematologica. 2014 Jul;99(7):1138-48. doi: 10.3324/haematol.2013.098384. Haematologica. 2014. PMID: 24986876 Free PMC article. Review.
-
In vitro and in vivo evidence for uncoupling of B-cell receptor internalization and signaling in chronic lymphocytic leukemia.Haematologica. 2018 Mar;103(3):497-505. doi: 10.3324/haematol.2017.176164. Epub 2017 Dec 14. Haematologica. 2018. PMID: 29242301 Free PMC article.
-
Understanding B-cell tolerance through the use of immunoglobulin transgenic models.Immunol Res. 2008;40(3):208-23. doi: 10.1007/s12026-007-8008-7. Immunol Res. 2008. PMID: 17943232 Review.
References
-
- Healy, J.I., R.E. Dolmetsch, L.A. Timmerman, J.G. Cyster, M.L. Thomas, G.R. Crabtree, R.S. Lewis, and C.C. Goodnow. 1997. Different nuclear signals are activated by the B cell receptor during positive versus negative signaling. Immunity. 6:419–428. - PubMed
-
- Dolmetsch, R.E., R.S. Lewis, C.C. Goodnow, and J.I. Healy. 1997. Differential activation of transcription factors induced by Ca2+ response amplitude and duration. Nature. 386:855–858. - PubMed
-
- Glynne, R., S. Akkaraju, J.I. Healy, J. Rayner, C.C. Goodnow, and D.H. Mack. 2000. How self-tolerance and the immunosuppressive drug FK506 prevent B-cell mitogenesis. Nature. 403:672–676. - PubMed
-
- Rui, L., C.G. Vinuesa, J. Blasioli, and C.C. Goodnow. 2003. Resistance to CpG DNA-induced autoimmunity through tolerogenic B cell antigen receptor-ERK signaling. Nat. Immunol. 4:594–600. - PubMed
-
- Benschop, R.J., K. Aviszus, X. Zhang, T. Manser, J.C. Cambier, and L.J. Wysocki. 2001. Activation and anergy in bone marrow B cells of a novel immunoglobulin transgenic mouse that is both hapten specific and autoreactive. Immunity. 14:33–43. - PubMed
Publication types
MeSH terms
Substances
LinkOut - more resources
Full Text Sources
Other Literature Sources
Medical
Molecular Biology Databases
Research Materials
Miscellaneous

