

Accelerated denaturation of hemoglobin and the antimalarial action of chloroquine
- PMID: 16801420
- PMCID: PMC1489787
- DOI: 10.1128/AAC.01652-05
Accelerated denaturation of hemoglobin and the antimalarial action of chloroquine
Abstract
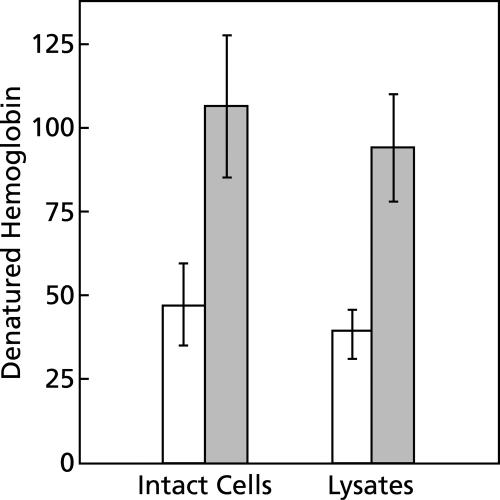
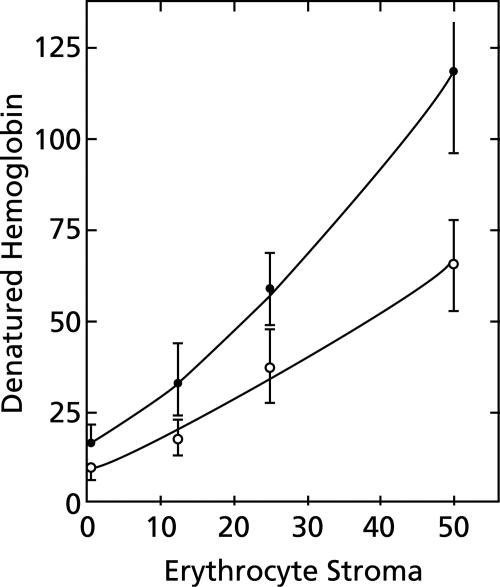
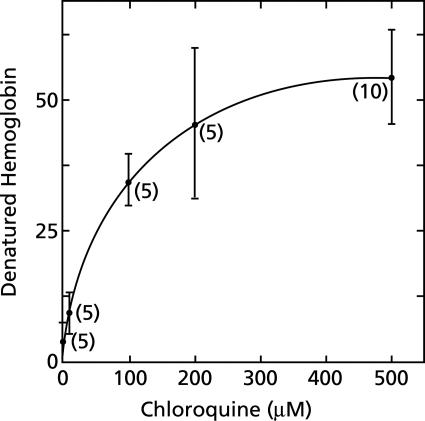
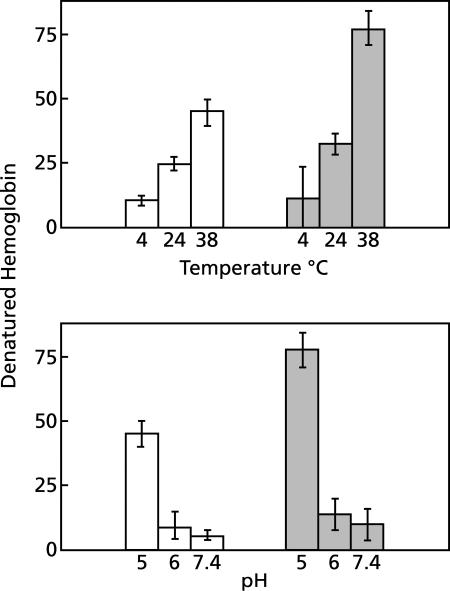
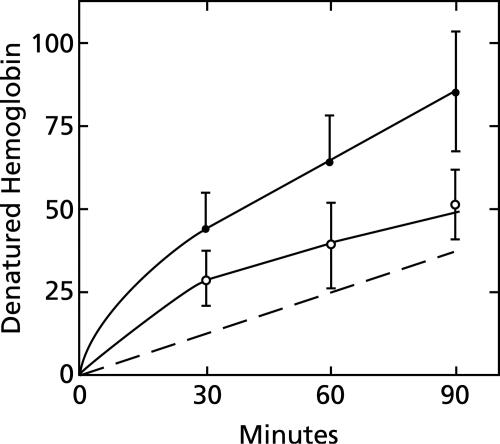
To study the antimalarial action of chloroquine, normal mouse erythrocytes were used as surrogates for erythrocytoid bodies. These bodies form in the endosomes of intraerythrocytic malaria parasites as they feed on their host and consist of erythrocyte cytoplasm enclosed in a vestige of the erythrocyte membrane. In suspensions of normal erythrocytes or lysates (equivalent to 5 microl of erythrocytes per ml in each case), hemoglobin underwent denaturation when it was incubated at 38 degrees C in 150 mM sodium acetate (pH 5). It is reasonable to assume that the same phenomenon occurs in acidic endosomes. Addition of 100 microM chloroquine to the incubation mixture caused the rate of hemoglobin denaturation to double to 40 nanomoles per hour per ml of packed erythrocytes. This effect required the presence of erythrocyte stroma and was inhibited by reducing the temperature to 24 degrees C or increasing the pH to 6. We propose that the primary antimalarial action of chloroquine is to bind to ferriprotoporphyrin IX (FP) and remove it from oxidized hemoglobin, thus producing toxic FP-chloroquine complexes and an excess of denatured globin. Furthermore, we suggest that these substances inhibit endosomal maturation and thereby cause hemoglobin accumulation in immature endosomes and masking of the lipids needed for FP dimerization. The term "masking" is used to signify that unsaturated lipids are present in parasitized erythrocytes but are specifically unavailable to promote FP dimerization.
Figures
Similar articles
-
Ferriprotoporphyrin IX: a mediator of the antimalarial action of oxidants and 4-aminoquinoline drugs.Prog Clin Biol Res. 1984;155:119-30. Prog Clin Biol Res. 1984. PMID: 6382310
-
Diverse membrane-active agents modify the hemolytic response to ferriprotoporphyrin IX.J Pharmacol Exp Ther. 1983 Jun;225(3):729-34. J Pharmacol Exp Ther. 1983. PMID: 6602875
-
Ferriprotoporphyrin IX: role in chloroquine susceptibility and resistance in malaria.Prog Clin Biol Res. 1989;313:45-52. Prog Clin Biol Res. 1989. PMID: 2675116 Review.
-
Mode of action of antimalarial drugs.Ciba Found Symp. 1983;94:222-32. Ciba Found Symp. 1983. PMID: 6341003
-
Ferriprotoporphyrin IX, phospholipids, and the antimalarial actions of quinoline drugs.Life Sci. 2004 Mar 5;74(16):1957-72. doi: 10.1016/j.lfs.2003.10.003. Life Sci. 2004. PMID: 14967191 Review.
Cited by
-
In vivo splenic clearance correlates with in vitro deformability of red blood cells from Plasmodium yoelii-infected mice.Infect Immun. 2014 Jun;82(6):2532-41. doi: 10.1128/IAI.01525-13. Epub 2014 Mar 31. Infect Immun. 2014. PMID: 24686065 Free PMC article.
-
1,4-naphthoquinones and other NADPH-dependent glutathione reductase-catalyzed redox cyclers as antimalarial agents.Curr Pharm Des. 2013;19(14):2512-28. doi: 10.2174/1381612811319140003. Curr Pharm Des. 2013. PMID: 23116403 Free PMC article. Review.
-
Analysis of gene mutations involved in chloroquine resistance in Plasmodium falciparum parasites isolated from patients in the southwest of Saudi Arabia.Ann Saudi Med. 2010 May-Jun;30(3):187-92. doi: 10.4103/0256-4947.62826. Ann Saudi Med. 2010. PMID: 20427933 Free PMC article.
-
Novel antimalarial aminoquinolines: heme binding and effects on normal or Plasmodium falciparum-parasitized human erythrocytes.Antimicrob Agents Chemother. 2009 Oct;53(10):4339-44. doi: 10.1128/AAC.00536-09. Epub 2009 Aug 3. Antimicrob Agents Chemother. 2009. PMID: 19651905 Free PMC article.
References
-
- Bannister, L. H., J. M. Hopkins, R. E. Fowler, S. Krishna, and G. H. Mitchell. 2000. A brief illustrated guide to the ultrastructure of Plasmodium falciparum asexual blood stages. Parasitol. Today 16:427-433. - PubMed
-
- Chou, A. C., and C. D. Fitch. 1992. Heme polymerase: modulation by chloroquine treatment of a rodent malaria. Life Sci. 51:2073-2078. - PubMed
Publication types
MeSH terms
Substances
LinkOut - more resources
Full Text Sources
