

Insights into the mechanism of microtubule stabilization by Taxol
- PMID: 16801540
- PMCID: PMC1502429
- DOI: 10.1073/pnas.0603704103
Insights into the mechanism of microtubule stabilization by Taxol
Abstract
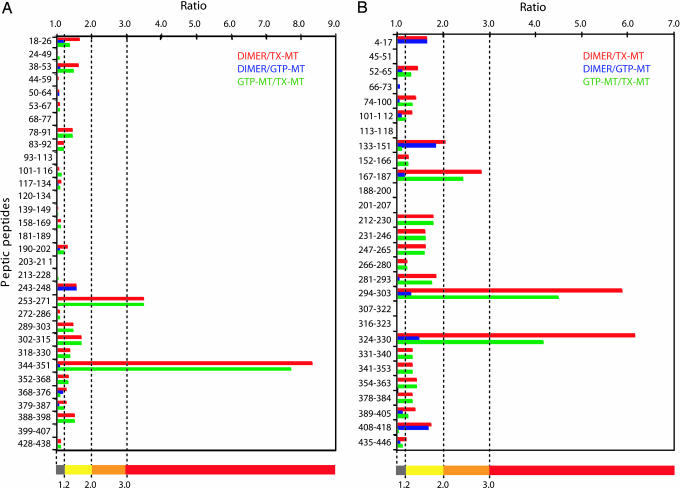
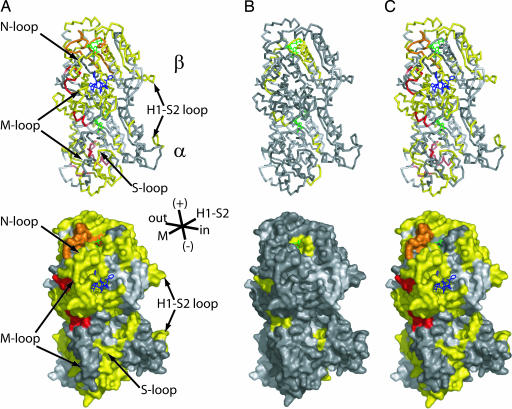
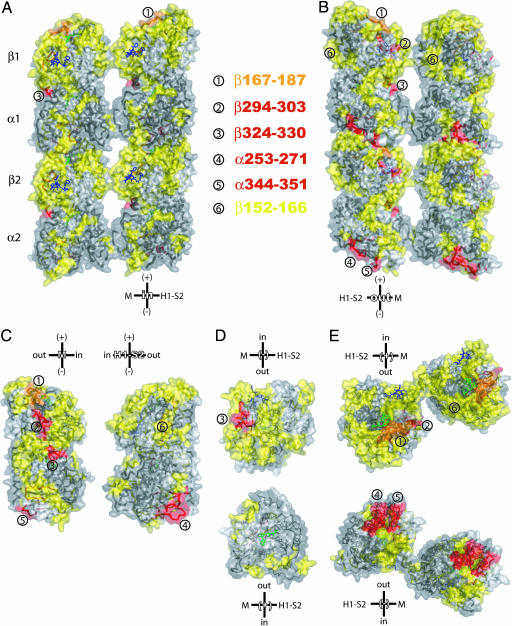
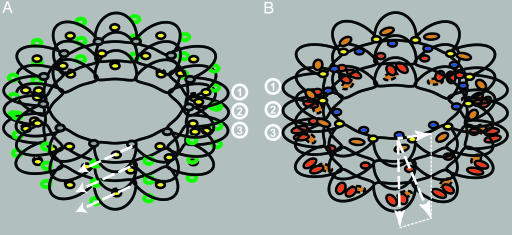
The antitumor drug Taxol stabilizes microtubules and reduces their dynamicity, promoting mitotic arrest and cell death. Upon assembly of the alpha/beta-tubulin heterodimer, GTP bound to beta-tubulin is hydrolyzed to GDP reaching a steady-state equilibrium between free tubulin dimers and microtubules. The binding of Taxol to beta-tubulin in the polymer results in cold-stable microtubules at the expense of tubulin dimers, even in the absence of exogenous GTP. However, there is little biochemical insight into the mechanism(s) by which Taxol stabilizes microtubules. Here, we analyze the structural changes occurring in both beta- and alpha-tubulin upon microtubule stabilization by Taxol. Hydrogen/deuterium exchange (HDX) coupled to liquid chromatography-electrospray ionization MS demonstrated a marked reduction in deuterium incorporation in both beta-and alpha-tubulin when Taxol was present. Decreased local HDX in peptic peptides was mapped on the tubulin structure and revealed both expected and new dimer-dimer interactions. The increased rigidity in Taxol microtubules was distinct from and complementary to that due to GTP-induced polymerization. The Taxol-induced changes in tubulin conformation act against microtubule depolymerization in a precise directional way. These results demonstrate that HDX coupled to liquid chromatography-electrospray ionization MS can be effectively used to study conformational effects induced by small ligands on microtubules. The present study also opens avenues for locating drug and protein binding sites and for deciphering the mechanisms by which their interactions alter the conformation of microtubules and tubulin dimers.
Conflict of interest statement
Conflict of interest statement: No conflicts declared.
Figures
Similar articles
-
Distinct pose of discodermolide in taxol binding pocket drives a complementary mode of microtubule stabilization.Biochemistry. 2009 Dec 15;48(49):11664-77. doi: 10.1021/bi901351q. Biochemistry. 2009. PMID: 19863156 Free PMC article.
-
Taxol allosterically alters the dynamics of the tubulin dimer and increases the flexibility of microtubules.Biophys J. 2008 Oct;95(7):3252-8. doi: 10.1529/biophysj.108.133884. Epub 2008 Jul 11. Biophys J. 2008. PMID: 18621813 Free PMC article.
-
Structural evidence for cooperative microtubule stabilization by Taxol and the endogenous dynamics regulator MAP4.ACS Chem Biol. 2012 Apr 20;7(4):744-52. doi: 10.1021/cb200403x. Epub 2012 Feb 6. ACS Chem Biol. 2012. PMID: 22270553 Free PMC article.
-
Taxol®: The First Microtubule Stabilizing Agent.Int J Mol Sci. 2017 Aug 9;18(8):1733. doi: 10.3390/ijms18081733. Int J Mol Sci. 2017. PMID: 28792473 Free PMC article. Review.
-
Anti-tubulin agents of natural origin: Targeting taxol, vinca, and colchicine binding domains.Eur J Med Chem. 2019 Jun 1;171:310-331. doi: 10.1016/j.ejmech.2019.03.025. Epub 2019 Mar 14. Eur J Med Chem. 2019. PMID: 30953881 Review.
Cited by
-
Nano-positioning and tubulin conformation contribute to axonal transport regulation of mitochondria along microtubules.Proc Natl Acad Sci U S A. 2022 Nov 8;119(45):e2203499119. doi: 10.1073/pnas.2203499119. Epub 2022 Nov 2. Proc Natl Acad Sci U S A. 2022. PMID: 36322761 Free PMC article.
-
Ultra-High-Resolution IonStar Strategy Enhancing Accuracy and Precision of MS1-Based Proteomics and an Extensive Comparison with State-of-the-Art SWATH-MS in Large-Cohort Quantification.Anal Chem. 2021 Mar 23;93(11):4884-4893. doi: 10.1021/acs.analchem.0c05002. Epub 2021 Mar 9. Anal Chem. 2021. PMID: 33687211 Free PMC article.
-
Clinical implications of REST and TUBB3 in ovarian cancer and its relationship to paclitaxel resistance.Tumour Biol. 2012 Oct;33(5):1759-65. doi: 10.1007/s13277-012-0435-y. Epub 2012 Jun 10. Tumour Biol. 2012. PMID: 22684772
-
Profile of Susan Band Horwitz.Proc Natl Acad Sci U S A. 2006 Jul 5;103(27):10163-10165. doi: 10.1073/pnas.0604639103. Epub 2006 Jun 26. Proc Natl Acad Sci U S A. 2006. PMID: 16801530 Free PMC article. No abstract available.
-
Molecular understanding of label-free second harmonic imaging of microtubules.Nat Commun. 2019 Aug 6;10(1):3530. doi: 10.1038/s41467-019-11463-8. Nat Commun. 2019. PMID: 31387998 Free PMC article.
References
-
- Nogales E., Wolf S. G., Downing K. H. Nature. 1998;391:199–203. - PubMed
-
- Sharp D. J., Rogers G. C., Scholey J. M. Nature. 2000;407:41–47. - PubMed
-
- Desai A., Mitchison T. J. Annu. Rev. Cell Dev. Biol. 1997;13:83–117. - PubMed
-
- Diaz J. F., Menendez M., Andreu J. M. Biochemistry. 1993;32:10067–10077. - PubMed
-
- Schiff P. B., Fant J., Horwitz S. B. Nature. 1979;277:665–667. - PubMed
Publication types
MeSH terms
Substances
Grants and funding
LinkOut - more resources
Full Text Sources
Other Literature Sources
