. 2006 Jul 5;103(27):10514-10519.
doi: 10.1073/pnas.0510319103. Epub 2006 Jun 26.

Just one cross appears capable of dramatically altering the population biology of a eukaryotic pathogen like Toxoplasma gondii

Affiliations

Just one cross appears capable of dramatically altering the population biology of a eukaryotic pathogen like Toxoplasma gondii

Jon P Boyle et al. Proc Natl Acad Sci U S A. .

Abstract

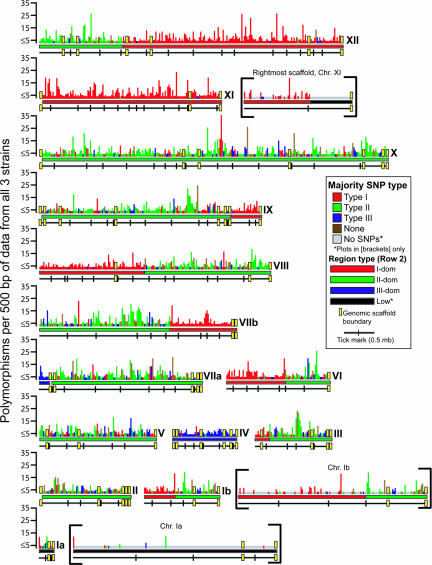
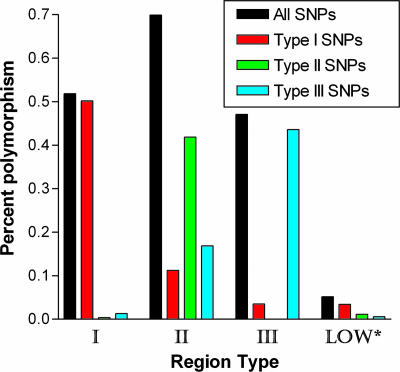
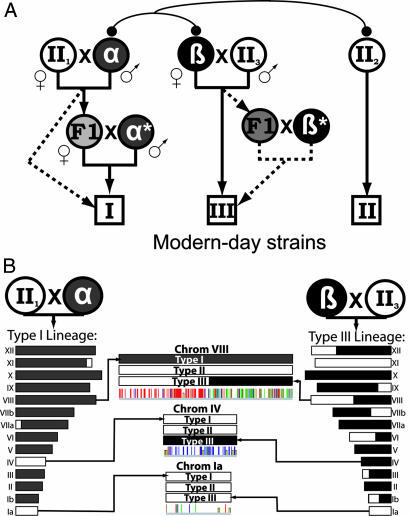
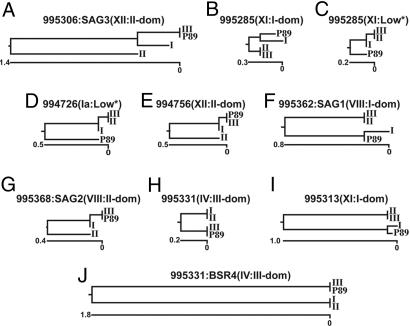
Toxoplasma gondii, an obligate intracellular protozoan of the phylum Apicomplexa, is estimated to infect over a billion people worldwide as well as a great many other mammalian and avian hosts. Despite this ubiquity, the vast majority of human infections in Europe and North America are thought to be due to only three genotypes. Using a genome-wide analysis of single-nucleotide polymorphisms, we have constructed a genealogy for these three lines. The data indicate that types I and III are second- and first-generation offspring, respectively, of a cross between a type II strain and one of two ancestral strains. An extant T. gondii strain (P89) appears to be the modern descendant of the non-type II parent of type III, making the full genealogy of the type III clonotype known. The simplicity of this family tree demonstrates that even a single cross can lead to the emergence and dominance of a new clonal genotype that completely alters the population biology of a sexual pathogen.


Conflict of interest statement

Conflict of interest statement: No conflicts declared.

Figures

Fig. 1.
Fig. 1.
SNP maps of all 14 T. gondii chromosomes. Genomic scaffolds are ordered and oriented as described in ref. , and yellow spacers represent junctions between scaffolds. The color of each bar (representing a 500-bp window) in the top row was determined as described in Materials and Methods. The height of each bar is a linear representation of the number of SNPs per 500 bp of overlapping sequence from all three strains in that particular window. The second row represents how the chromosomal regions were classified by using the red/green/blue color scheme, with black bars representing regions of comparatively low polymorphism. Each tick mark on the third row represents 0.5 Mb. For chromosomes Ia, Ib, and the rightmost end of XI, plots (in brackets) are shown that contain gray bars where 50 bp of overlapping data were available from all three strains, but no SNPs were detected. *Low, regions of comparatively low polymorphism.
Fig. 2.
Fig. 2.
Total polymorphism percentages (i.e., SNPs per 100 bp) and those of each SNP type (I, II, or III) in chromosomal regions of low polymorphism percentage (Low), or those dominated by type I, II, or III SNPs. The percent polymorphism was calculated by determining the number of SNPs and the number of “informative” sites in a particular region (at least two sequences per strain at that particular site), summed over all similar regions. Region boundaries are as displayed in Fig. 1 as red (type I-dominated), green (type II-dominated), blue (type III-dominated), or black (low polymorphism percentage) bars on the second row of each chromosome plot.
Fig. 3.
Fig. 3.
Proposed genealogy of three major T. gondii lineages and chromosome segregation during the proposed crosses. (A) Model for the creation of the three canonical T. gondii clonotypes. Lines at the top connecting α, β, and type II2 demonstrate the predicted degree of relatedness between these three strains, where α and β are more closely related to each other than they are to type II strains. In this model, the hypothetical strains II1 and II3 are highly similar to the ancestor of modern type II (II2), although that relatedness is not shown for simplicity. For the hypothetical crosses, both single and single plus backcross models are shown, and solid lines indicate the most likely scenario based on cross simulation data. The sexes of the parents are derived from SNP analysis of the maternally inherited plastid organelle in the type I, II, and III strains, and for the β × type II3 cross they are only shown for the single cross model because the parentage cannot be determined under the backcross model. (B) Chromosome segregation during the two proposed crosses (II1 × α and II3 × β) that would explain the SNP patterns on chromosomes VIII, IV and Ia, which contain examples of all four observed SNP patterns. On the far left (for type I) and right (for type III), all 14 chromosomes are represented schematically with their proposed parental origin [denoted by gray (α), black (β), or white (type II)]. Similar schematics are shown in the center for chromosomes VIII, IV and Ia along with the observed SNP map patterns.
Fig. 4.
Fig. 4.
Phylograms of 10 loci representing region-specific sequence divergence among the three major T. gondii clonotypes (I, II, and III) and strain P89. Numbers above phylograms are genomic scaffold numbers and the gene name (if available). The chromosomal source and the region type are listed in parentheses. All phylograms are shown on the same scale, and units of divergence are in substitutions per 100 nucleotides. Primer (or flanking) sequences for all 10 loci and genomic coordinates are listed in Table 1. *Low, a region of comparatively low polymorphism percentage.

Similar articles

Cited by

References

    1. Tibayrenc M., Ayala F. J. Trends Parasitol. 2002;18:405–410. - PubMed
    1. Webster I. P. Parasitology. 1994;108:407–411. - PubMed
    1. Ferguson D. J., Henriquez F. L., Kirisits M. J., Muench S. P., Prigge S. T., Rice D. W., Roberts C. W., McLeod R. L. Eukaryot. Cell. 2005;4:814–826. - PMC - PubMed
    1. Aspinall T. V., Guy E. C., Roberts K. E., Joynson D. H., Hyde J. E., Sims P. F. Int. J. Parasitol. 2003;33:97–103. - PubMed
    1. Ajzenberg D., Banuls A. L., Su C., Dumetre A., Demar M., Carme B., Darde M. L. Int. J. Parasitol. 2004;34:1185–1196. - PubMed

Publication types

Associated data