

Nanog binds to Smad1 and blocks bone morphogenetic protein-induced differentiation of embryonic stem cells
- PMID: 16801560
- PMCID: PMC1502451
- DOI: 10.1073/pnas.0506945103
Nanog binds to Smad1 and blocks bone morphogenetic protein-induced differentiation of embryonic stem cells
Abstract
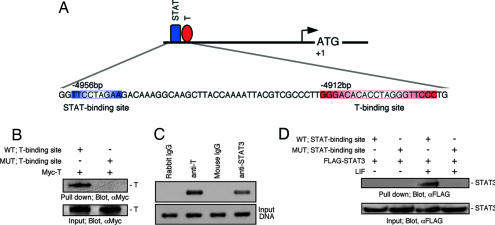
ES cells represent a valuable model for investigating early embryo development and hold promise for future regenerative medicine strategies. The self-renewal of pluripotent mouse ES cells has been shown to require extrinsic stimulation by the bone morphogenetic protein (BMP) and leukemia inhibitory factor signaling pathways and the expression of the transcription factors Oct4 and Nanog. However, the network of interactions among extrinsic and intrinsic determinants of ES cell pluripotency is currently poorly understood. Here, we show that Nanog expression is up-regulated in mouse ES cells by the binding of T (Brachyury) and STAT3 to an enhancer element in the mouse Nanog gene. We further show that Nanog blocks BMP-induced mesoderm differentiation of ES cells by physically interacting with Smad1 and interfering with the recruitment of coactivators to the active Smad transcriptional complexes. Taken together, our findings illustrate the existence of ES cell-specific regulatory networks that underlie the maintenance of ES cell pluripotency and provide mechanistic insights into the role of Nanog in this process.
Conflict of interest statement
Conflict of interest statement: No conflicts declared.
Figures


Similar articles
-
Maintenance of embryonic stem cell pluripotency by Nanog-mediated reversal of mesoderm specification.Nat Clin Pract Cardiovasc Med. 2006 Mar;3 Suppl 1:S114-22. doi: 10.1038/ncpcardio0442. Nat Clin Pract Cardiovasc Med. 2006. PMID: 16501617
-
Self-renewal of teratocarcinoma and embryonic stem cells.Oncogene. 2004 Sep 20;23(43):7150-60. doi: 10.1038/sj.onc.1207930. Oncogene. 2004. PMID: 15378075 Review.
-
Id1 maintains embryonic stem cell self-renewal by up-regulation of Nanog and repression of Brachyury expression.Stem Cells Dev. 2012 Feb 10;21(3):384-93. doi: 10.1089/scd.2011.0428. Epub 2011 Dec 1. Stem Cells Dev. 2012. PMID: 22013995
-
BMP induction of Id proteins suppresses differentiation and sustains embryonic stem cell self-renewal in collaboration with STAT3.Cell. 2003 Oct 31;115(3):281-92. doi: 10.1016/s0092-8674(03)00847-x. Cell. 2003. PMID: 14636556
-
The homeodomain protein Nanog and pluripotency in mouse embryonic stem cells.Biochem Soc Trans. 2005 Dec;33(Pt 6):1518-21. doi: 10.1042/BST0331518. Biochem Soc Trans. 2005. PMID: 16246159 Review.
Cited by
-
Smad2 is essential for maintenance of the human and mouse primed pluripotent stem cell state.J Biol Chem. 2013 Jun 21;288(25):18546-60. doi: 10.1074/jbc.M112.446591. Epub 2013 May 6. J Biol Chem. 2013. PMID: 23649632 Free PMC article.
-
TGFβ Family Signaling Pathways in Pluripotent and Teratocarcinoma Stem Cells' Fate Decisions: Balancing Between Self-Renewal, Differentiation, and Cancer.Cells. 2019 Nov 23;8(12):1500. doi: 10.3390/cells8121500. Cells. 2019. PMID: 31771212 Free PMC article. Review.
-
SHP-1 arrests mouse early embryo development through downregulation of Nanog by dephosphorylation of STAT3.PLoS One. 2014 Jan 21;9(1):e86330. doi: 10.1371/journal.pone.0086330. eCollection 2014. PLoS One. 2014. PMID: 24466030 Free PMC article.
-
Adult Neural Stem Cells: Basic Research and Production Strategies for Neurorestorative Therapy.Stem Cells Int. 2018 Apr 1;2018:4835491. doi: 10.1155/2018/4835491. eCollection 2018. Stem Cells Int. 2018. PMID: 29760724 Free PMC article. Review.
-
Pluripotency gene network dynamics: System views from parametric analysis.PLoS One. 2018 Mar 29;13(3):e0194464. doi: 10.1371/journal.pone.0194464. eCollection 2018. PLoS One. 2018. PMID: 29596533 Free PMC article.
References
-
- Evans M. J., Kaufman M. H. Nature. 1981;292:154–156. - PubMed
-
- Chambers I., Smith A. Oncogene. 2004;23:7150–7160. - PubMed
-
- Smith A. G., Heath J. K., Donaldson D. D., Wong G. G., Moreau J., Stahl M., Rogers D. Nature. 1988;336:688–690. - PubMed
-
- Williams R. L., Hilton D. J., Pease S., Willson T. A., Stewart C. L., Gearing D. P., Wagner E. F., Metcalf D., Nicola N. A., Gough N. M. Nature. 1988;336:684–687. - PubMed
Publication types
MeSH terms
Substances
LinkOut - more resources
Full Text Sources
Other Literature Sources
Medical
Molecular Biology Databases
Research Materials
Miscellaneous
