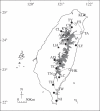
Allozyme variation of populations of Castanopsis carlesii (Fagaceae) revealing the diversity centres and areas of the greatest divergence in Taiwan
- PMID: 16803847
- PMCID: PMC2803562
- DOI: 10.1093/aob/mcl135
Allozyme variation of populations of Castanopsis carlesii (Fagaceae) revealing the diversity centres and areas of the greatest divergence in Taiwan
Abstract
Background and aims: The genetic variation and divergence estimated by allozyme analysis were used to reveal the evolutionary history of Castanopsis carlesii in Taiwan. Two major questions were discussed concerning evolutionary issues: where are the diversity centres, and where are the most genetically divergent sites in Taiwan?
Methods: Twenty-two populations of C. carlesii were sampled throughout Taiwan. Starch gel electrophoresis was used to assay allozyme variation. Genetic parameters and mean FST values of each population were analysed using the BIOSYS-2 program. Mean F(ST) values of each population against the remaining populations, considered as genetic divergence, were estimated using the FSTAT program.
Key results: Average values of genetic parameters describing the within-population variation, the average number of alleles per locus (A=2.5), the effective number of alleles per locus (Ae=1.38), the allelic richness (Ar=2.38), the percentage of polymorphic loci (P=69%), and the expected heterozygosity (He=0.270) were estimated. High levels of genetic diversity were found for C. carlesii compared with other local plant species. Genetic differentiation between populations was generally low.
Conclusions: From the data of expected heterozygosity, one major diversity centre was situated in central Taiwan corroborating previous reports for other plant species. According to the mean FST value of each population, the most divergent populations were situated in two places. One includes populations located in north central Taiwan between 24.80 degrees N and 24.20 degrees N. The other is located in south-eastern Taiwan between 22.40 degrees N and 23.10 degrees N. These two regions are approximately convergent with the most divergent locations determined for several other plant species using chloroplast DNA markers published previously. An important finding obtained from this study is that unordered markers like allozymes can be used to infer past population histories as well as chloroplast DNA markers do.
Figures


Similar articles
-
Potential refugia in Taiwan revealed by the phylogeographical study of Castanopsis carlesii Hayata (Fagaceae).Mol Ecol. 2005 Jun;14(7):2075-85. doi: 10.1111/j.1365-294X.2005.02567.x. Mol Ecol. 2005. PMID: 15910328
-
Allozyme variation of Cyclobalanopsis championii (Fagaceae), a narrowly distributed species in southern Taiwan.J Hered. 2001 Jan-Feb;92(1):65-70. doi: 10.1093/jhered/92.1.65. J Hered. 2001. PMID: 11336231
-
Divergence maintained by climatic selection despite recurrent gene flow: a case study of Castanopsis carlesii (Fagaceae).Mol Ecol. 2016 Sep;25(18):4580-92. doi: 10.1111/mec.13764. Epub 2016 Sep 6. Mol Ecol. 2016. PMID: 27447352
-
Levels of genetic polymorphism: marker loci versus quantitative traits.Philos Trans R Soc Lond B Biol Sci. 1998 Feb 28;353(1366):187-98. doi: 10.1098/rstb.1998.0201. Philos Trans R Soc Lond B Biol Sci. 1998. PMID: 9533123 Free PMC article. Review.
-
Abiotic genetic adaptation in the Fagaceae.Plant Biol (Stuttg). 2019 Sep;21(5):783-795. doi: 10.1111/plb.13008. Epub 2019 May 31. Plant Biol (Stuttg). 2019. PMID: 31081234 Review.
Cited by
-
Approximate Bayesian computation analysis of EST-associated microsatellites indicates that the broadleaved evergreen tree Castanopsis sieboldii survived the Last Glacial Maximum in multiple refugia in Japan.Heredity (Edinb). 2019 Mar;122(3):326-340. doi: 10.1038/s41437-018-0123-9. Epub 2018 Aug 2. Heredity (Edinb). 2019. PMID: 30072800 Free PMC article.
-
Population genetic characteristics of Aedes aegypti in 2019 and 2020 under the distinct circumstances of dengue outbreak and the COVID-19 pandemic in Yunnan Province, China.Front Genet. 2023 Mar 9;14:1107893. doi: 10.3389/fgene.2023.1107893. eCollection 2023. Front Genet. 2023. PMID: 36968606 Free PMC article.
-
Diversification, biogeographic pattern, and demographic history of Taiwanese Scutellaria species inferred from nuclear and chloroplast DNA.PLoS One. 2012;7(11):e50844. doi: 10.1371/journal.pone.0050844. Epub 2012 Nov 30. PLoS One. 2012. PMID: 23226402 Free PMC article.
-
Intraspecific karyotypic polymorphism is highly concordant with allozyme variation in Lysimachia mauritiana (Primulaceae: Myrsinoideae) in Taiwan: implications for the colonization history and dispersal patterns of coastal plants.Ann Bot. 2012 Nov;110(6):1119-35. doi: 10.1093/aob/mcs192. Epub 2012 Sep 28. Ann Bot. 2012. PMID: 23022678 Free PMC article.
-
Isolation by elevation: genetic structure at neutral and putatively non-neutral loci in a dominant tree of subtropical forests, Castanopsis eyrei.PLoS One. 2011;6(6):e21302. doi: 10.1371/journal.pone.0021302. Epub 2011 Jun 20. PLoS One. 2011. PMID: 21701584 Free PMC article.
References
-
- Avise JC. 1994. Molecular markers, natural history and evolution. New York, NY: Chapman and Hall.
-
- Belahbib N, Pemonge MH, Ouassou A, Sbay H, Kremer A, Petit RJ. 2001. Frequent cytoplasmic exchanges between oak species that are not closely related: Quercus suber and Q. ilex in Morocco. Molecular Ecology 10: 2003–2012. - PubMed
-
- Bennett KD. 1990. Milankovitch cycles and their effects on species in ecological and evolutionary time. Paleobiology 16: 11–21.
-
- Bonnet E, Van de Peer Y. 2002. zt: a software tool for simple and partial Mantel tests. Journal of Statistical Software 7: 1–12.
-
- Cheliak WM, Pitel JA. 1984. Techniques for starch gel electrophoresis of enzymes from forest tree species. Information report PI-X-42. Chalk River, Ontario: Petawawa National Forestry Institute, 19–45.
Publication types
MeSH terms
Substances
LinkOut - more resources
Full Text Sources
Research Materials
Miscellaneous

