. 1991 Oct 18;67(2):303-10.
doi: 10.1016/0092-8674(91)90182-x.

Progression of the cell cycle through mitosis leads to abortion of nascent transcripts

Affiliations

Progression of the cell cycle through mitosis leads to abortion of nascent transcripts

A W Shermoen et al. Cell. .

Abstract

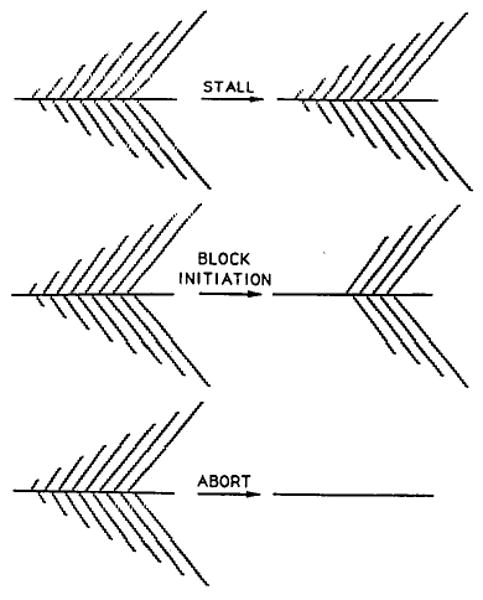
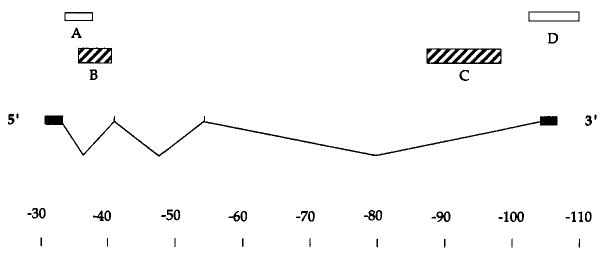
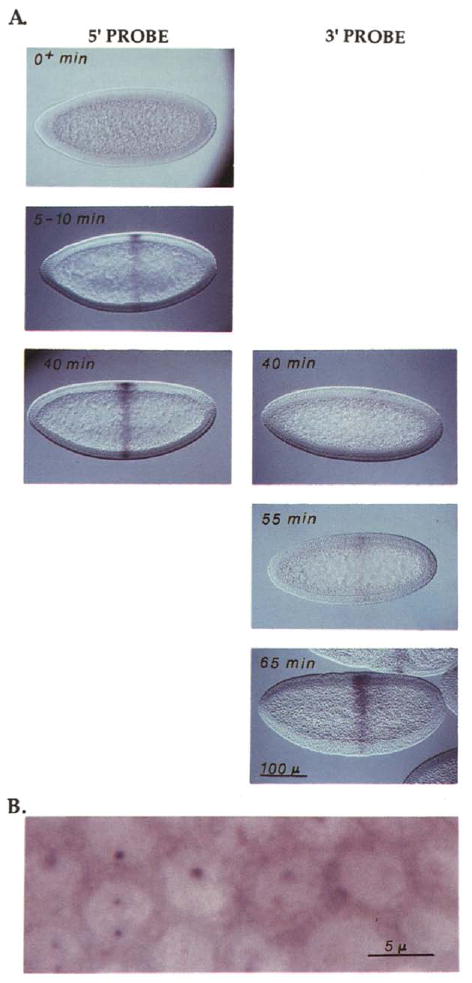
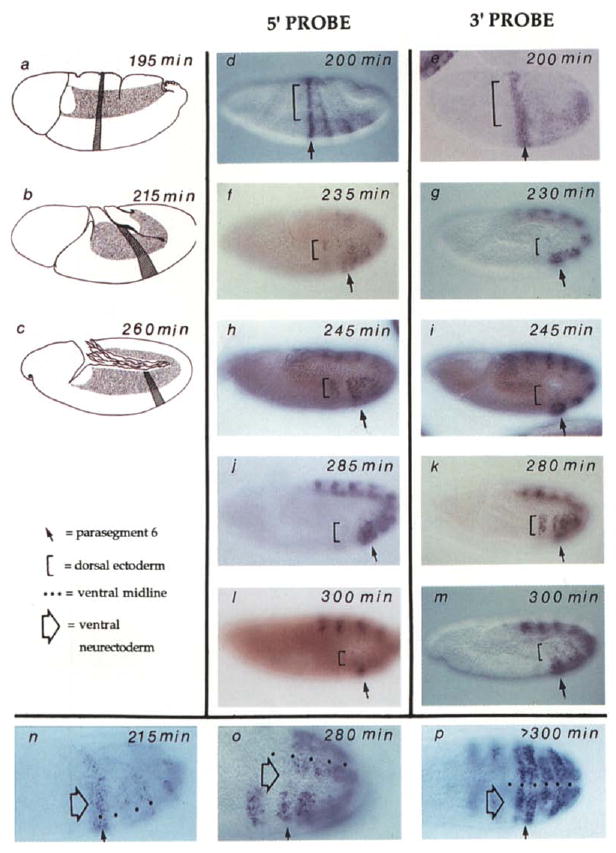
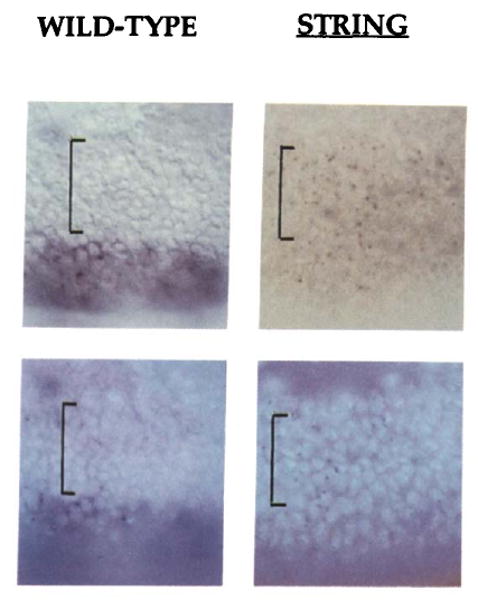
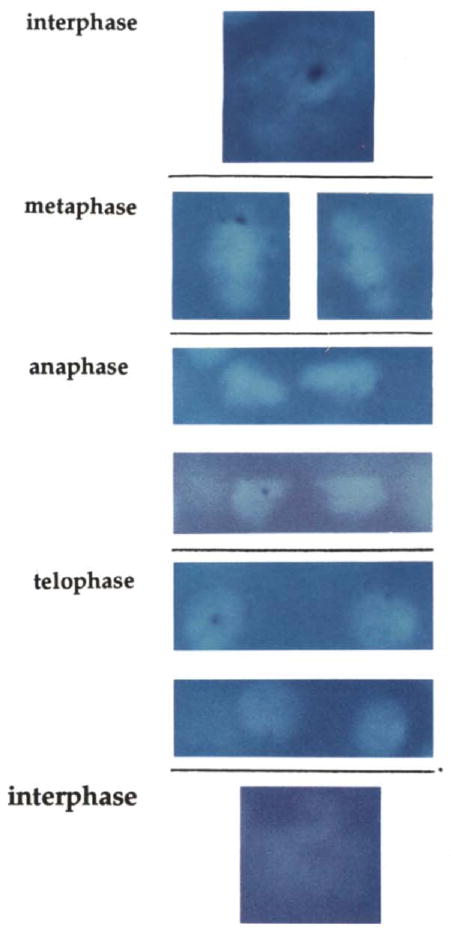
Nascent transcripts of the Drosophila Ubx gene were detected by in situ hybridization. Following onset of expression, the progress of RNA polymerase (1.4 kb/min) across the gene was visualized as the successive appearance of hybridization signals from different positions within the transcription unit. Nascent transcripts disappeared at mitosis. Hybridization signals reappeared in the next cell cycle first with a 5' probe, and later, following a delay consistent with the transcription rate, with a 3' probe. Nascent transcripts were observed continuously in expressing cells of a mutant embryo in which cells are blocked in interphase. We conclude that progression through mitosis causes abortion of nascent transcripts and suggest that periodic abortion of transcription contributes to regulation of expression of large genes.


Figures

Figure 1
Figure 1. Alternative Models for the Inhibition of Transcription at Mitosis
Figure 2
Figure 2. Probes for the Ubx Transcription Unit
The positions of the four Ubx exons are indicated relative to a scale in kb. Only one of the alternative splicing patterns is indicated. The major mature transcripts of 3.2 and 4.3 kb, while differing in their inclusion of the internal exons, are derived from a roughly 77 kb primary transcript. The boxes above indicate the positions of probes used in this study. Unless indicated otherwise, probes described as 5′ and 3′ refer to probes B and C, respectively. Probe B is recessed from the 5′ end by 3.5 kb, and probe C falls about 10 kb short of the 3′ end. The 5′ ends of these probes are separated by 52 kb. This schematic of the Ubx transcription unit is based on O'Connor et al. (1988).
Figure 3
Figure 3. Progression of Transcription along the Ubx Gene in Early Cycle 14
(A) Embryos where hybridized with either a 5′ or 3′ probe, stained, and then staged according to the depth of penetration of the membranes that invaginate between nuclei during cellularization. Based on live time-lapse records, the rate of this penetration is known, allowing translation of the depth of penetration into time after mitosis 13 (note that completion of mitosis 13 occurs at 130 min AED and marks the beginning of cell cycle 14). These times are given in the upper left of each panel, and the panels are arranged in a temporal sequence, top to bottom. Staining is evident earlier with the 5′ probe (left) than with the 3′ probe (right). The signal with the 5′ probe appears about 5 min after mitosis 13, while it is not until 40 min after mitosis 13 that a hint of staining is seen with the 3′ probe. The scale bar indicates about 100 μm. (B) To visualize the nuclear dots, an early stage 8 embryo, comparable to those in (A), was hybridized with probe A and photographed at a higher magnification and at a superficial focal plane. Each cell with evident Ubx expression has two dots in its nucleus, although not all of these are evident at the focal plane of this picture. Diffuse cytoplasmic signal and a very weak diffuse nuclear signal are also evident. It should be noted that the disposition of the dots is not constant. At some stages only one dot is resolved, and often with Ubx probes the dots are found closely opposed to the nuclear membrane. The bar indicates approximately 5 μm.
Figure 4
Figure 4. Transient Absence of Ubx Nascent Transcripts in Recently Divided Cells
Wild-type embryos at various stages of cell cycle 14 and 15 are shown. In all panels except (n) to (p), anterior is left and ventral is down. The locations of PS6 (hatch stripe) and mitotic domain 11 (stippled region) are shown in the drawings on the left (a–c). These illustrate the shape changes during the movements of germband extension in which cells move ventrally to form the germband, which extends posteriorly, turns, and folds back upon itself. In the photographs, PS6 is indicated by an arrow and the dorsal ectoderm by a bracket (d–m) and a neurectoderm region just lateral to the ventral midline by a large open arrow (n–p). The age of the embryos in min AED was estimated by morphological criteria and progression of cell division domains (Campos-Ortega and Hartenstein, 1985; Foe, 1989) and is indicated on each panel. The embryos that are viewed from the side (d–m) are arranged according to age (top to bottom) so that staining with the 5′ probe (central column) can be compared to embryos at a similar stage stained with the 3′ probe (right column). In (d) and (e) are shown the patterns of Ubx expression as visualized about 10 to 15 min before division 14 begins in the dorsal ectoderm. Note that expression posterior to PS6 initiates later than PS6 expression (compare [d] to Figure 3) and is not yet evident with the 3′ probe in (e). Also, the embryo in (e) was flattened during slide preparation more than the other embryos in this display. In (f) and (g) are shown embryos shortly after completion of mitosis 14 in the dorsal ectoderm. No 3′ signal is seen (g) in this domain, while some heterogeneity (staining and nonstaining cells) is seen in this region with the 5′ probe. As discussed in the text, disappearance of signal is associated with progress through mitosis, and the heterogeneity of expression with the 5′ probe (f) is due to reappearance of signal in cells that have progressed further into cycle 15. Note that the brownish red color of the embryos in (f) and (I) appeared during observation under UV light and is not relevant to the hybridization signal. In (h) and (i) are shown embryos 20 min after mitosis 14 in the dorsal ectoderm. A strong signal is seen in this region with the 5′ probe but not with the 3′ probe. In (j) and (k) are shown embryos about 50 min after mitosis in the dorsal ectoderm. A strong signal is in the dorsal ectoderm with both 5′ and 3′ probes. Mitosis 15 has begun in some regions of the dorsal ectoderm of the embryo shown in (j) (fluorescence of Hoechst 33258–stained DNA allowed visualization of these mitoses; data not shown) and signal with the 5′ probe has been lost in some regions, notably in PSS. In (I) and (m) are shown embryos in which most of the cells of the dorsal ectoderm have progressed through mitosis 15 and signal is again absent from this region with both 5′ and 3′ probes. Note that the faint mottled expression in the dorsal ectoderm of the embryo in (m) is due to staining of cells in a focal plane below the ectoderm. Such nonectodermal cells divide according to a different schedule. In (n), (o), and (p) are shown embryos oriented so that the ventral region is visible. The dots mark the ventral midline. These embryos have been hybridized with the 3′ probe. At stages prior to mitosis 14 (n) and well after mitosis (p) the signal spans the ventral region of the embryo. In (o) there is an interruption in the signal in a region just lateral to the midline (large open arrow). This corresponds to mitotic domain N where mitosis has recently been completed. The signal is mottled in the more ventral region Oust adjacent to the midline marked by dots), which corresponds to mitotic domain M where division is in progress (some cells have divided and others have not).
Figure 5
Figure 5. Ubx Nascent Transcripts Persist When the Cell Cycle Is Arrested in Interphase
The surface of embryos in the area of PS6 is shown illuminated by transmitted light (top) or by fluorescence of the DNA-specific dye Hoechst 33258 (bottom). The hybridization signal from the 3′ Ubx probe is most easily seen in the upper images. In the wild-type embryo on the left, the dorsal ectoderm (region marked by the bracket) has recently divided and shows no signal, while the larger and as yet undivided cells of the ventral ectoderm show obvious expression. In the string mutant embryo on the right, although at the same stage as the wild-type embryo, there has been no cell division because string blocks the cell cycle in interphase 14. The larger size of the nuclei in the dorsal ectoderm of the string embryo can be seen in the fluorescent image. The dorsal cells of string mutant embryos show a localized nuclear hybridization signal. The low level of diffuse staining of the string mutant embryo is characteristic of later string embryos. At present we do not know why an intron probe should give cytoplasmic background (see text) in wild-type embryos (ventral region of embryo on left), nor why it is reduced in a string mutant embryo.
Figure 6
Figure 6. The Localized Nuclear Hybridization Signal Fades during the Course of Mitosis
Embryos were hybridized with the 5′ probe and stained with Hoechst 33258. The bright fluorescence of the Hoechst shows the DNA, and the hybridization signal is evident as a dark blue dot. Individual cells from PS6 are shown at different stages of progression through mitosis 14. Although the hybridization signal in metaphase cells is strong, it is reduced in comparison to interphase 14 cells. Anaphase cells have a weak signal, and a signal can sometimes be detected in telophase cells and sometimes not. A pair of telophase nuclei showing a relatively strong signal is shown, as well as two other more representative nuclei that show a signal that is at the limit of detectability. At this level of sensitivity no signal is seen in cells that have just returned to an interphase configuration.

References

    1. Akam M, Martinez-Arias A. The distribution of Ultrabithorax transcripts in Drosophila embryos. EMBO J. 1985;4:1687–1700. - PMC - PubMed
    1. Campos-Ortega JA, Hartenstein V. The Embryonic Development of Drosophila melanogaster. Berlin, Heidelberg, New York, Tokyo: Springer-Verlag; 1985.
    1. Cisek L, Corden J. Phosphorylation of RNA polymerase by the murine homologue of the cell-cycle control protein cdc2. Nature. 1989;339:679–684. - PubMed
    1. Edgar BA, O'Farrell PH. Genetic control of cell division patterns in the Drosophila embryo. Cell. 1989;57:177–187. - PMC - PubMed
    1. Edgar BA, O'Farrell PH. The three postblastoderm cell cycles of Drosophila embryogenesis are regulated in G2 by string. Cell. 1990;62:469–480. - PMC - PubMed

Publication types

MeSH terms

LinkOut - more resources