

Identification of arthritis-related gene clusters by microarray analysis of two independent mouse models for rheumatoid arthritis
- PMID: 16805906
- PMCID: PMC1779393
- DOI: 10.1186/ar1985
Identification of arthritis-related gene clusters by microarray analysis of two independent mouse models for rheumatoid arthritis
Abstract
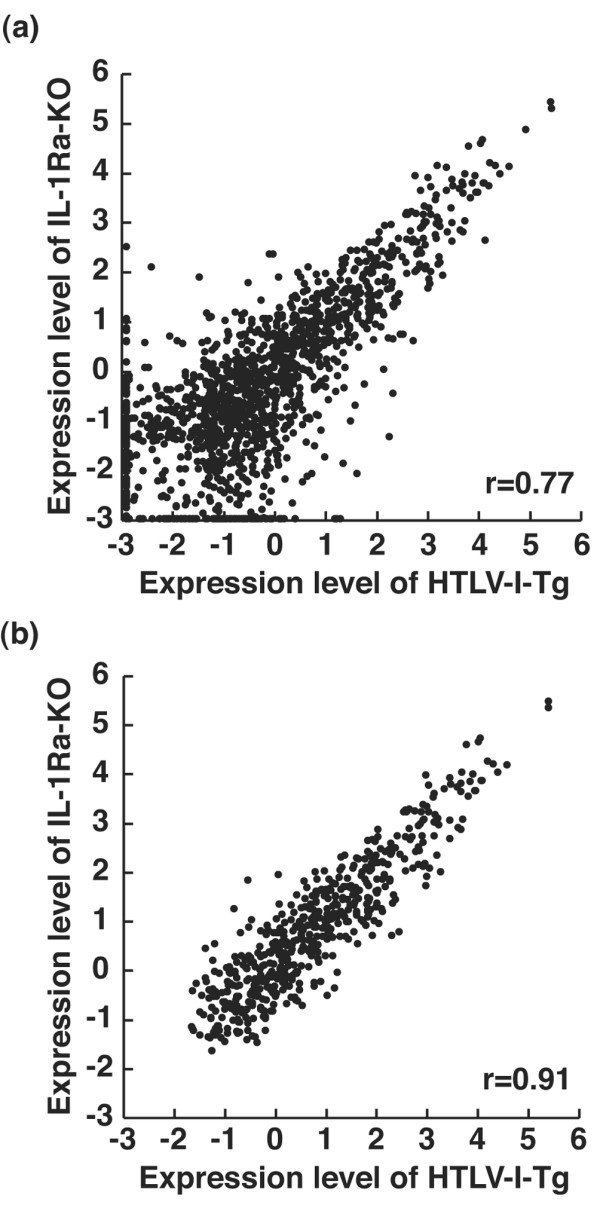
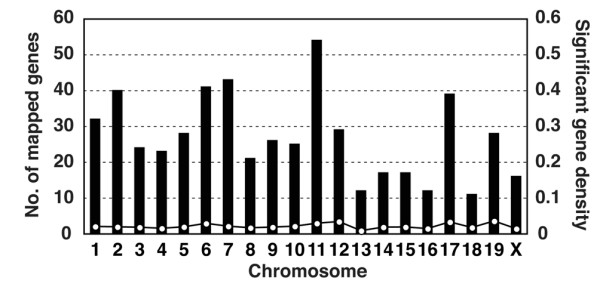
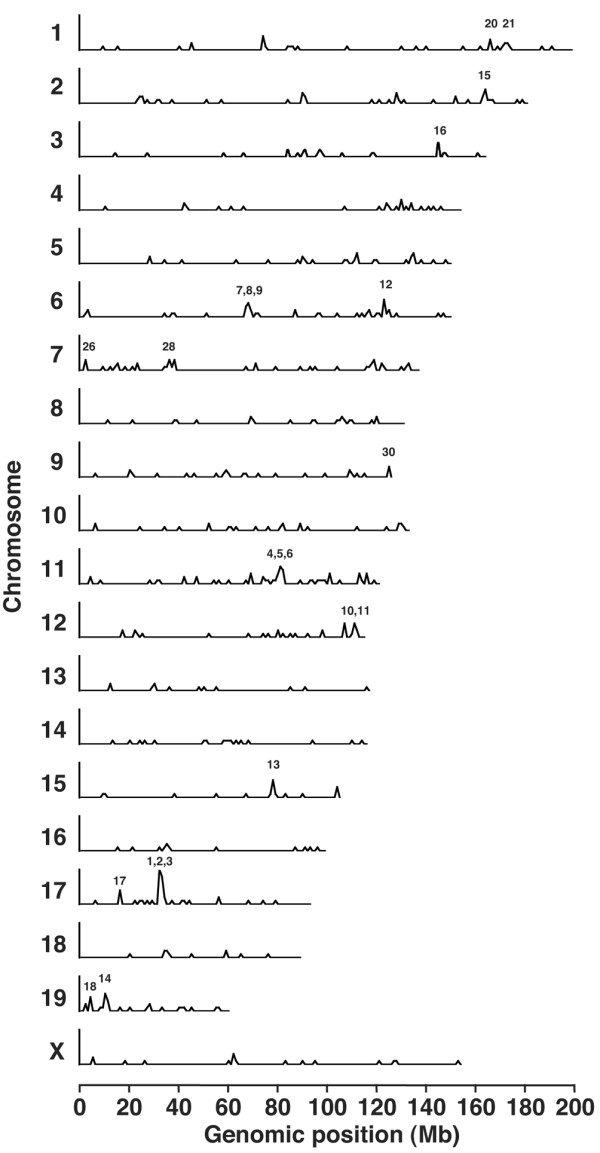
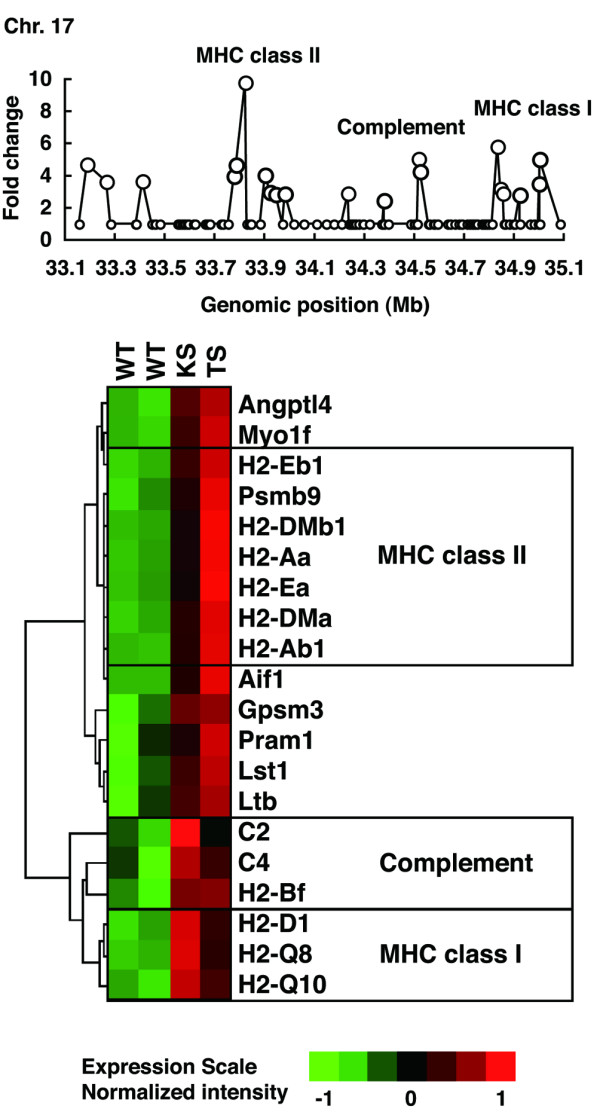
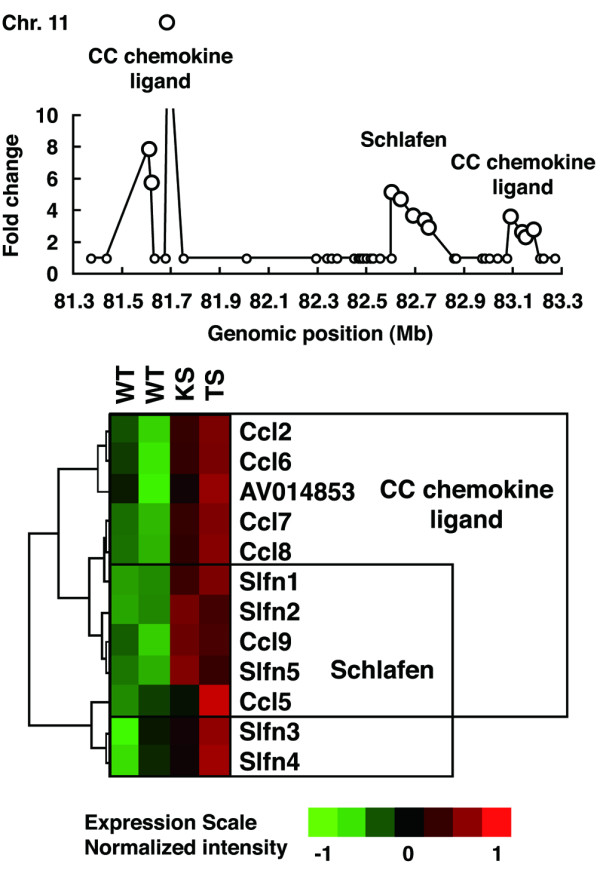
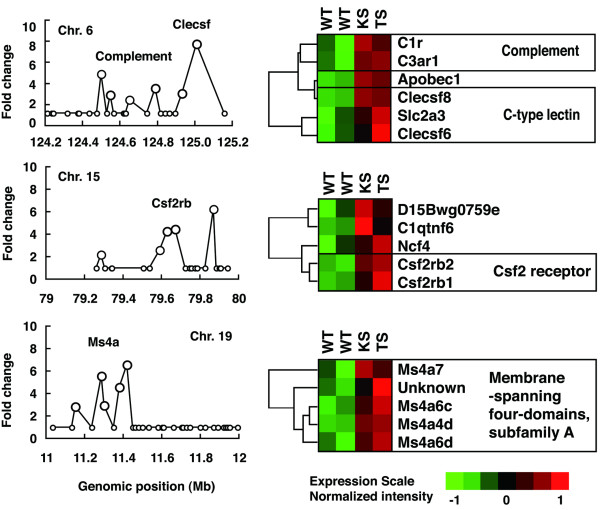
Rheumatoid arthritis (RA) is an autoimmune disease affecting approximately 1% of the population worldwide. Previously, we showed that human T-cell leukemia virus type I-transgenic mice and interleukin-1 receptor antagonist-knockout mice develop autoimmunity and joint-specific inflammation that resembles human RA. To identify genes involved in the pathogenesis of arthritis, we analyzed the gene expression profiles of these animal models by using high-density oligonucleotide arrays. We found 1,467 genes that were differentially expressed from the normal control mice by greater than threefold in one of these animal models. The gene expression profiles of the two models correlated well. We extracted 554 genes whose expression significantly changed in both models, assuming that pathogenically important genes at the effector phase would change in both models. Then, each of these commonly changed genes was mapped into the whole genome in a scale of the 1-megabase pairs. We found that the transcriptome map of these genes did not distribute evenly on the chromosome but formed clusters. These identified gene clusters include the major histocompatibility complex class I and class II genes, complement genes, and chemokine genes, which are well known to be involved in the pathogenesis of RA at the effector phase. The activation of these gene clusters suggests that antigen presentation and lymphocyte chemotaxis are important for the development of arthritis. Moreover, by searching for such clusters, we could detect genes with marginal expression changes. These gene clusters include schlafen and membrane-spanning four-domains subfamily A genes whose function in arthritis has not yet been determined. Thus, by combining two etiologically different RA models, we succeeded in efficiently extracting genes functioning in the development of arthritis at the effector phase. Furthermore, we demonstrated that identification of gene clusters by transcriptome mapping is a useful way to find potentially pathogenic genes among genes whose expression change is only marginal.
Figures
Similar articles
-
Antigen-induced differential gene expression in lymphocytes and gene expression profile in synovium prior to the onset of arthritis.Autoimmunity. 2006 Dec;39(8):663-73. doi: 10.1080/08916930601062643. Autoimmunity. 2006. PMID: 17178563
-
Gene expression profiles in the rat streptococcal cell wall-induced arthritis model identified using microarray analysis.Arthritis Res Ther. 2005;7(1):R101-17. doi: 10.1186/ar1458. Epub 2004 Nov 19. Arthritis Res Ther. 2005. PMID: 15642130 Free PMC article.
-
Chemokine receptors in the rheumatoid synovium: upregulation of CXCR5.Arthritis Res Ther. 2005;7(2):R217-29. doi: 10.1186/ar1475. Epub 2004 Dec 16. Arthritis Res Ther. 2005. PMID: 15743468 Free PMC article.
-
Where do T cells stand in rheumatoid arthritis?Joint Bone Spine. 2005 Dec;72(6):527-32. doi: 10.1016/j.jbspin.2004.12.012. Epub 2005 Jun 29. Joint Bone Spine. 2005. PMID: 16087382 Review.
-
Genetic analysis of collagen-induced arthritis in rats: a polygenic model for rheumatoid arthritis predicts a common framework of cross-species inflammatory/autoimmune disease loci.Immunol Rev. 2001 Dec;184:172-83. doi: 10.1034/j.1600-065x.2001.1840116.x. Immunol Rev. 2001. PMID: 12086311 Review.
Cited by
-
TARM1 contributes to development of arthritis by activating dendritic cells through recognition of collagens.Nat Commun. 2021 Jan 4;12(1):94. doi: 10.1038/s41467-020-20307-9. Nat Commun. 2021. PMID: 33397982 Free PMC article.
-
Cluster analysis on high dimensional RNA-seq data with applications to cancer research - An evaluation study.PLoS One. 2019 Dec 5;14(12):e0219102. doi: 10.1371/journal.pone.0219102. eCollection 2019. PLoS One. 2019. PMID: 31805048 Free PMC article.
-
Inflammation and immune system activation in aging: a mathematical approach.Sci Rep. 2013 Nov 19;3:3254. doi: 10.1038/srep03254. Sci Rep. 2013. PMID: 24247109 Free PMC article.
-
The MS4A family: counting past 1, 2 and 3.Immunol Cell Biol. 2016 Jan;94(1):11-23. doi: 10.1038/icb.2015.48. Epub 2015 Apr 3. Immunol Cell Biol. 2016. PMID: 25835430 Review.
-
The CTRP3-AdipoR2 Axis Regulates the Development of Experimental Autoimmune Encephalomyelitis by Suppressing Th17 Cell Differentiation.Front Immunol. 2021 Dec 2;12:607346. doi: 10.3389/fimmu.2021.607346. eCollection 2021. Front Immunol. 2021. PMID: 34925309 Free PMC article.
References
-
- Firestein GS, Zvaifler NJ. Rheumatoid Arthritis: A Disease of Disordered Immunity. New York: Raven Press; 1992.
-
- Iwakura Y, Tosu M, Yoshida E, Takiguchi M, Sato K, Kitajima I, Nishioka K, Yamamoto K, Takeda T, Hatanaka M, et al. Induction of inflammatory arthropathy resembling rheumatoid arthritis in mice transgenic for HTLV-I. Science. 1991;253:1026–1028. - PubMed
Publication types
MeSH terms
LinkOut - more resources
Full Text Sources
Other Literature Sources
Medical
