. 2007 Jan;41(1):51-61.
doi: 10.1016/j.ceca.2006.04.032. Epub 2006 Jun 27.

TRPM4 controls insulin secretion in pancreatic beta-cells

Affiliations

TRPM4 controls insulin secretion in pancreatic beta-cells

Henrique Cheng et al. Cell Calcium. 2007 Jan.

Abstract

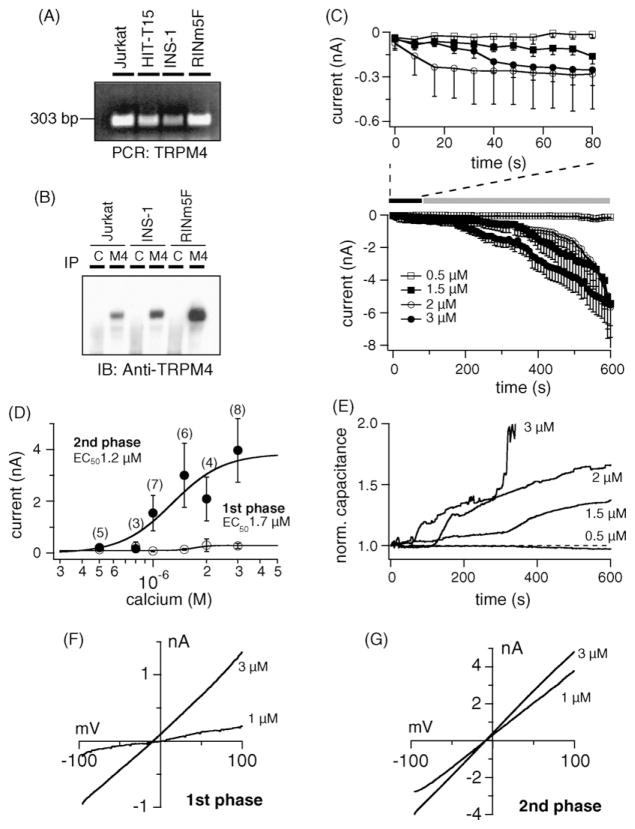
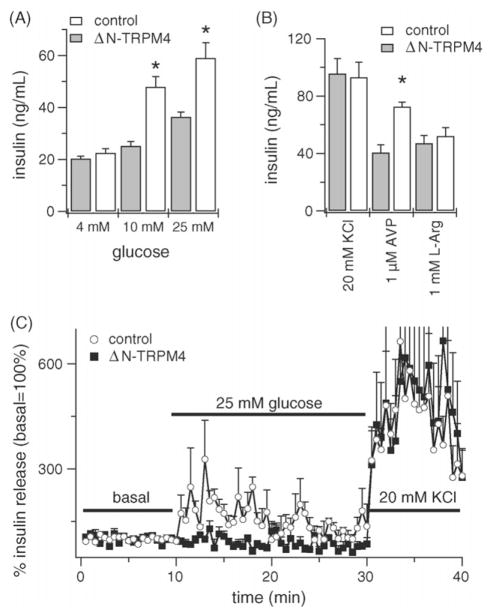
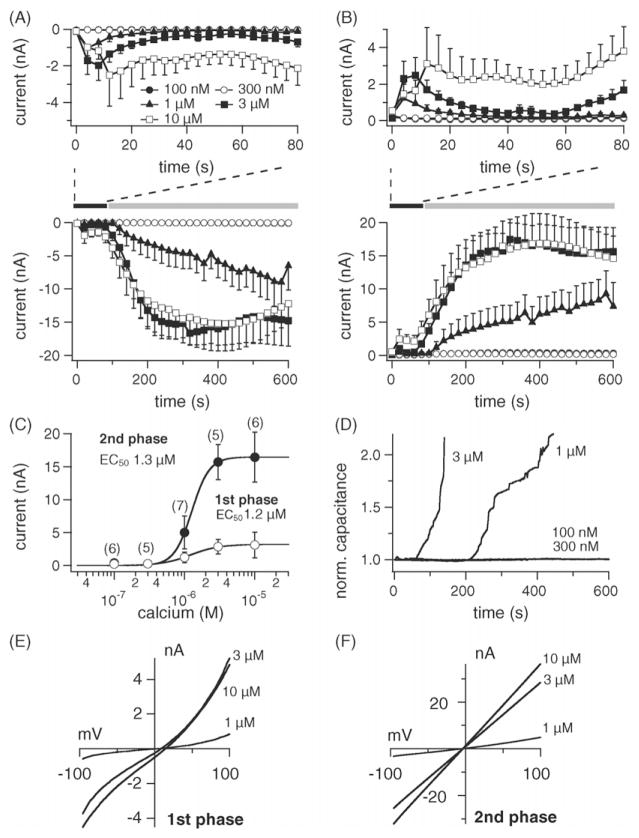
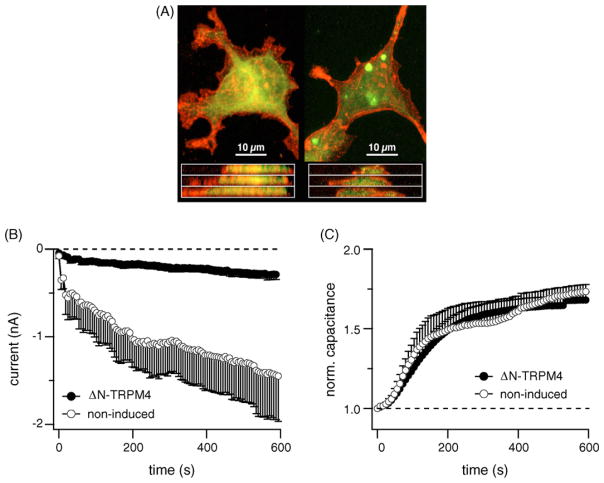
TRPM4 is a calcium-activated non-selective cation channel that is widely expressed and proposed to be involved in cell depolarization. In excitable cells, TRPM4 may regulate calcium influx by causing the depolarization that drives the activation of voltage-dependent calcium channels. We here report that insulin-secreting cells of the rat pancreatic beta-cell line INS-1 natively express TRPM4 proteins and generate large depolarizing membrane currents in response to increased intracellular calcium. These currents exhibit the characteristics of TRPM4 and can be suppressed by expressing a dominant negative TRPM4 construct, resulting in significantly decreased insulin secretion in response to a glucose stimulus. Reduced insulin secretion was also observed with arginine vasopressin stimulation, a Gq-coupled receptor agonist in beta-cells. Moreover, the recruitment of TRPM4 currents was biphasic in both INS-1 cells as well as HEK-293 cells overexpressing TRPM4. The first phase is due to activation of TRPM4 channels localized within the plasma membrane followed by a slower secondary phase, which is caused by the recruitment of TRPM4-containing vesicles to the plasma membrane during exocytosis. The secondary phase can be observed during perfusion of cells with increasing [Ca(2+)](i), replicated with agonist stimulation, and coincides with an increase in cell capacitance, loss of FM1-43 dye, and vesicle fusion. Our data suggest that TRPM4 may play a key role in the control of membrane potential and electrical activity of electrically excitable secretory cells and the dynamic translocation of TRPM4 from a vesicular pool to the plasma membrane via Ca(2+)-dependent exocytosis may represent a key short- and midterm regulatory mechanism by which cells regulate electrical activity.


Figures

Fig. 1
Fig. 1
Characterization of TRPM4 currents in pancreatic β-cells. (A) Total RNA from different cell lines was isolated as described and transcribed into cDNA. RT-PCR was performed with specific primers for TRPM4. Jurkat T-lymphocytes were used as positive control. (B) Detection of TRPM4 proteins. Cells were analyzed for expression of TRPM4 protein after immunoprecipitation/immunoblotting with the polyclonal antibody against TRPM4 (M4; C indicates immunoprecipitation with an irrelevant antibody). (C) Lower panel: average inward currents carried by TRPM4 from INS-1 cells (mean ± S.E.M.) extracted at − 80 mV with [Ca2+]i buffered between 0.5 and 3 μM. Upper panel: average inward currents showing the first phase during the initial 80 s after establishment of whole-cell configuration (n = 4–7 cells/concentration). Note the development of the first phase, followed by a secondary phase that is associated with increases in cell capacitance (see panel E). (D) Dose–response curves for the first and second phase of TRPM4 activation with current amplitudes extracted at +80 mV either at 80 s (first phase, open circles) or 600 s into the experiment (second phase, closed circles). (E) Normalized capacitance changes from representative cells in (C). Capacitance was normalized to the resting input capacitance measured immediately after break-in. (F) current–voltage relationship under experimental conditions as described above, taken from a representative cell at the peak of the first phase. (G) Current–voltage relationship from representative cells taken at 600 s.
Fig. 2
Fig. 2
TRPM4 suppression affects insulin secretion. (A) Effect of TRPM4 protein suppression on insulin secretion under static incubation conditions. Inhibition of TRPM4 by a dominant negative effect significantly decreased the response to 10 and 25 mM glucose stimulation compared to control cells. (B) A significant decrease in insulin secretion was also observed in arginine vasopressin stimulated cells. In this experiment, the response to KCl or L-arginine did not differ. Control cells were transfected with reagents without the ΔN-TRPM4 DNA. Values are mean ± S.E.M. (n = 4 wells/treatment group from three different cell passages; *P < 0.05 compared to same concentration). (C) Effect of TRPM4 suppression on insulin secretion under perifusion conditions. Inhibition of TRPM4 by a dominant negative effect significantly decreased the response to 25 mM glucose stimulation compared to control cells. INS-1 cells were perfused for 10 min with KRB containing 4 mM glucose to obtain a basal level and stimulated with 25 mM glucose for 20 min to induce insulin secretion. At the end, cells were depolarized with 20 mM KCl to test their viability. Control cells were transfected with reagents without the ΔN-TRPM4 DNA. Experiments represents mean ± S.E.M. (n = 3/group from three different cell passages).
Fig. 3
Fig. 3
Calcium-induced exocytosis and TRPM4 activation in HEK-293 cells. (A) Lower panel: average inward currents measured in HEK-293 cells overex- pressing TRPM4 (flag-TRPM4-TrexHEK293) at −80 mV where [Ca2+]i was buffered between 0.1 and 10 μM (mean ± S.E.M., n = 5–7 cells/concentration). Upper panel: average inward currents showing the first phase during the initial 80 s after establishment of whole-cell configuration. Note the development of the first phase during the initial 80 s of experiments, followed by a secondary phase that is associated with increased cell capacitance (see panel D). (B) Lower panel: average outward currents at +80 mV carried by TRPM4 from the same cells as in (A). Upper panel: average outward currents during the initial 80 s after establishment of whole-cell configuration. (C) Dose–response curves for the first and second phase of TRPM4 activation with current amplitudes extracted at +80 mV either at the peak of the first phase, or 600 s into the experiment (second phase). (D) Normalized capacitance changes from representative cells. (E) Current–voltage relationship under experimental conditions as described above, taken from representative cells at the peak of the first phase during the initial 80 s of experiments. (F) Current–voltage relationship from the same cells as in (E) extracted at 600 s of experimental time.
Fig. 4
Fig. 4
Stimulation of exocytosis results in FM1-43 dye loss and development of the secondary phase. (A) Representative fluorescence images of flag-TRPM4-TrexHEK293 cells loaded with FM1-43 and perfused with 100 nM Ca2+ (orange arrow) or control intact cells (white arrow) during 600 s. (B) Cells perfused with 1 μM Ca2+ (orange arrow) to induce exocytosis or control intact cell (white arrow) during 600 s. (C) Average fluorescence loss (mean ± S.E.M.) from cells perfused with 100 nM (n = 3) or 1 μM Ca2+ (n = 6) and intact controls (n = 9). (D) Average capacitance changes (mean ± S.E.M.) from cells that were patched simultaneously with fluorescence measurements (n = 3/group). (E) Average inward currents carried by TRPM4 at −80 mV from same cells in (D). (For interpretation of the references to colour in this figure legend, the reader is referred to the web version of the article.)
Fig. 5
Fig. 5
TRPM4 translocation and fusion with the plasma membrane. (A) Cellular localization of flag-TRPM4, in resting flag-TRPM4-TrexHEK293 (left panels), and l μM ionomycin treated cells (right panels), stained for flag-TRPM4 expression (red) with 2.5 mg/ml mouse anti-Flag primary antibody (Sigma), and visualized using an Alexa-568 conjugated anti-mouse secondary antibody (Invitrogen). Cell bodies were delineated using 1 mM Cell Tracker (green) prior to fixing. Confocal Z-series were taken using a BioRad 1024 inverted confocal laser microscope, with krypton/argon laser. Top panels are projected Z-stacked images taken at 0.65 mm increments through the cell, bottom panels are z-axis interpolated x-axis sections through the cell. Note the initial punctate localization of TRPM4 and shift of fluorescence to a plasma membrane localization following ionomycin treatment. (B) Average inward currents from ΔN-TRPM4 expressing cells (n = 14) and non-tetracycline induced control cells (n = 7) at −80 mV with [Ca2+]i buffered at 1 μM (mean ± S.E.M.). (C) Normalized capacitance changes from ΔN-TRPM4 expressing and control cells. Inhibition of TRPM4 currents by a dominant negative effect is clearly visible, but does not alter exocytosis. (For interpretation of the references to colour in this figure legend, the reader is referred to the web version of the article.)
Fig. 6
Fig. 6
Agonist-induced secondary phase in TRPM4 current. (A) Calcium measurement from HEK293 cells overexpressing TRPM4. Cells were stimulated with carbachol twice. First, to induce exocytosis of TRPM4-containing vesicles and second to activate the new pool of TRPM4 present in the plasma membrane. (B) Average inward currents (mean ± S.E.M.) carried by TRPM4 at −80 mV under unbuffered Ca2+ conditions. Cells were treated with carbachol twice according to protocol used in the calcium measurement experiments (n = 5). Control cells were treated with carbachol at 70 s (n = 3) or 750 s (n = 3). The Ca2+ response to carbachol is smaller during the second application, however, the currents generated due to increased TRPM4 at the plasma membrane are much larger. (C) Current–voltage relationship typical of TRPM4 obtained from a representative cell that received double (70 and 750 s) carbachol application. (D) Average changes in capacitance from cells in (B).

Similar articles

Cited by

References

    1. Clapham DE. TRP channels as cellular sensors. Nature. 2003;426:517–524. - PubMed
    1. Harteneck C, Plant TD, Schultz G. From worm to man: three subfamilies of TRP channels. Trends Neurosci. 2000;23:159–166. - PubMed
    1. Montell C, Birnbaumer L, Flockerzi V, Bindels RJ, Bruford EA, Caterina MJ, Clapham DE, Harteneck C, Heller S, Julius D, Kojima I, Mori Y, Penner R, Prawitt D, Scharenberg AM, Schultz G, Shimizu N, Zhu MX. A unified nomenclature for the superfamily of TRP cation channels. Mol Cell. 2002;9:229–231. - PubMed
    1. Xu XZ, Moebius F, Gill DL, Montell C. Regulation of melastatin, a TRP-related protein, through interaction with a cytoplasmic isoform. Proc Natl Acad Sci USA. 2001;98:10692–10697. - PMC - PubMed
    1. Launay P, Fleig A, Perraud AL, Scharenberg AM, Penner R, Kinet JP. TRPM4 is a Ca2+-activated nonselective cation channel mediating cell membrane depolarization. Cell. 2002;109:397–407. - PubMed

Publication types