. 2006 Jul 15;91(2):421-32.
doi: 10.1529/biophysj.106.077800.

Cooperative fluctuations point to the dimerization interface of p53 core domain

Affiliations

Cooperative fluctuations point to the dimerization interface of p53 core domain

Nigar Kantarci et al. Biophys J. .

Abstract

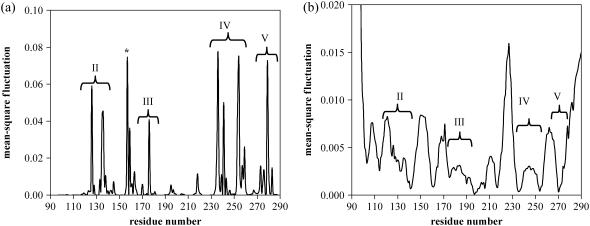
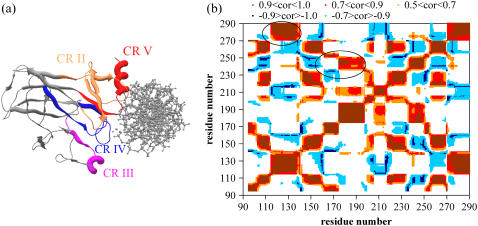
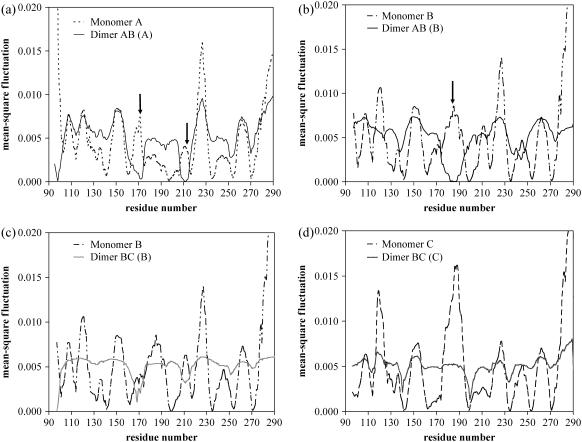
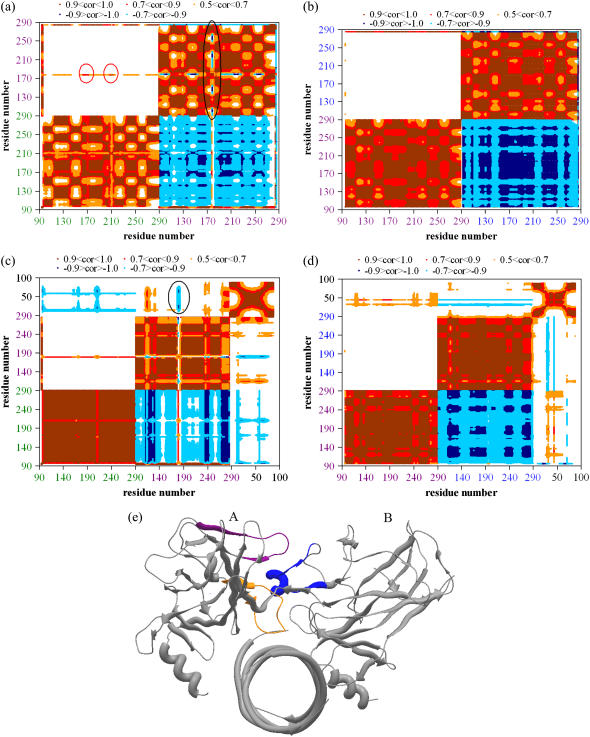
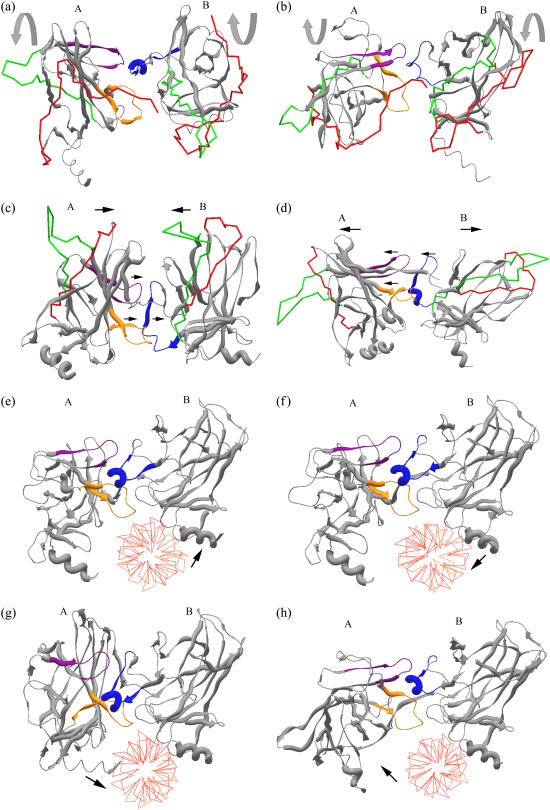
Elastic network models are used for investigation of the p53 core domain functional dynamics. Global modes of motion indicate high positive correlations for residue fluctuations across the A-B interface, which are not observed at the B-C interface. Major hinge formation is observed at the A-B interface upon dimerization indicating stability of the A-B dimer. These findings imply A-B as the native dimerization interface, whereas B-C is the crystal interface. The A-B dimer exhibits an opening-closing motion about DNA, supporting the previously suggested clamp-like model of nonspecific DNA binding followed by diffusion. Monomer A has limited positive correlations with DNA, while monomer B exhibits high positive correlations with DNA in the functionally significant slow modes. Thus, monomer B might seem to maintain the stability of the dimer-DNA complex by forming the relatively fixed arm of the dimer clamp, whereas the other arm of the clamp, monomer A, might allow sliding via continuous association/dissociation mechanisms.


Figures

FIGURE 1
FIGURE 1
(a) High (fastest 10 modes average) and (b) low frequency (slowest first and second modes average) fluctuations of isolated monomer A. Similar graphs are obtained for the isolated monomers B and C. The peaks of the high-frequency fluctuations and most of the hinges obtained from the minima of low-frequency fluctuations correspond to the four conserved, functionally important regions. Another peak outside the four conserved regions, which is indicated with an asterisk (*) in Fig. 1 a, will be shown to have a functional importance in subsequent analysis.
FIGURE 2
FIGURE 2
(a) Functionally important parts in the p53 core domain structure resolved by Cho et al. (10) with PDB code, 1tsr. Monomer B is displayed in complex with DNA (DNA axis perpendicular to the page). Four conserved regions (CR) are indicated on the figure. CR II is colored in orange corresponding to L1 loop (112–124) and S2 and S2′ sheets (124–141), CR III is colored in magenta corresponding to part of L2 loop and H1 helix (171–181), CR IV is colored in blue corresponding to L3 loop (236–251), and CR V is colored in red corresponding to end of S10 sheet (271–274) and H2 helix (278–286). These conserved regions have functional importance in maintaining the global structure of the protein and participating in DNA binding. (b) Cross-correlation map for isolated monomer A (including first three modes, which corresponds to 23% of the global motion). Regions colored in brown, red, and orange indicate positive correlations in order of highest to lowest positive correlation values. Blue regions indicate negative correlations, similarly, dark blue and light blue reflecting higher and lower negative correlation values, respectively. Two regions that are known to have functional importance (10) are emphasized with black circles on the figure. One of these two regions demonstrates the positive correlation between the residues of the loop-sheet-helix (L1 loop-S2 and S2′ sheets-H2 helix) motif of p53 that is responsible for the direct contact with DNA major groove. The other positive correlation reflects a relation between L2 and L3 loops; i.e., L3 loop makes direct contact with DNA minor groove and L2 has a stabilizing effect on L3 via coordination of a Zn atom. Thus, residues involved in similar functions are fluctuating in a cooperative manner.
FIGURE 3
FIGURE 3
Comparison of the average of the first two slowest modes across monomers and dimers. (a) Mean-square fluctuation of monomer A in isolated form (dotted line) and in A-B dimer complex (solid line). Two distinct regions indicated by arrows emphasize the decrease of mobility of these residues of monomer A upon dimerization; i.e., these regions gain stability when present in dimer form. (b) Mean-square fluctuation of monomer B in isolated form (dotted line) and in A-B dimer complex (dark solid line). One region exists, indicated by an arrow, where the mobility is decreased upon dimerization. (c) Mean-square fluctuation of monomer B in isolated form (dotted line) and in B-C dimer complex (dark solid line). No significant new hinge formation is observed upon dimerization. (d) Mean-square fluctuation of monomer C in isolated form (dotted line) and in B-C dimer complex (dark solid line). No significant new hinge formation is observed upon dimerization.
FIGURE 4
FIGURE 4
Cross-correlation maps for dimers presenting positive/negative correlations in the absence (panels a and b) and presence (panels c and d) of DNA. (including first three modes). In the axis, residue numbers colored in green belongs to monomer A, violet to monomer B, and blue to monomer C. Positive correlations are plotted in brown, red, and orange in decreasing correlation values and negative correlations are plotted in dark and light blue, similarly in decreasing correlation values. Map is symmetric for A-B and B-A, hence, negative correlations between A and B are not shown (but they are shown in B-A) to emphasize the existing positive correlations. (a) Correlation map for dimer A-B in the absence of DNA. Dimer A-B exhibits a positively correlated interface. Highest positive correlation exists between residues I162 and R175 and Y205 and S215 of monomer A with residues R175–G187 of monomer B (shown with red circles). Except the interface residues, monomers A and B display negative correlation in the rest of the structure implying motion in opposite directions; i.e., an opening-closing type of motion, while the dimer interface move in the same direction. The positive correlation at the interface would bring about stability to the dimeric structure. Although R175–G187 of monomer B exhibit positive correlation with monomer A at the interface, this region is negatively correlated with the rest of the monomer B residues (shown with a black oval), implying this interface region of monomer B moving in opposite direction with respect to the global monomer. (b) Correlation map for dimer B-C in the absence of DNA. No positive correlation is present at the B-C interface. (c) Correlation map for dimer A-B + DNA complex. DNA binding enhances the existing positive correlation at the A-B interface (the interface line is darker red than in panel a). Monomer A has dominantly negative correlation with DNA (minor positive correlation with DNA is observed in higher modes). Monomer B has mostly positive correlation with DNA except the A-B dimer interface (indicated with black circle). This indicates that binding affinities of the two monomers to DNA are not the same, i.e., monomer A probably binds less tightly to DNA whereas monomer B maintains stronger interaction with DNA. (d) Correlation map for dimer B-C + DNA complex: The lack of any positive correlation between B-C is still valid upon DNA binding. (e) Crystal structure of p53 (1tsr) dimers A and B in complex with DNA (monomer C not shown). The suggested dimerization interface, which possesses high positive correlation, is colored: I162-R175 (orange) and Y205-S215 (violet) of monomer A interact with R175-G187 (blue) of monomer B at the interface.
FIGURE 5
FIGURE 5
Alternative conformations of dimer A-B as a result of ANM calculations in absence (ad) and presence (eh) of DNA. The dimerization interface is indicated with orange, violet, and blue regions as in Fig. 4 e and red and green residues represented by rods are to distinguish between the two conformations and visualize the directions of global motion. The deformations are amplified for clarity. (a and b) Positive-negative deviations from the native structure obtained in first mode. The two monomers exhibit “twisting” around the interface in opposite directions whereas the interface residues preserved their close proximity. The directions of twisting are indicated on the figure for each monomer with respect to the native structure. (c and d) Positive-negative deviations from the native structure obtained in second mode. The monomers exhibit “bending” around interface in opposite directions. The global dimer can be viewed as an opening (d)-closing (c) clamp. The directions of motions are shown with arrows. The dimer interface residues move in the same direction. (e and f) Positive-negative deviations from the native structure obtained in the first mode for simulations including DNA. Interaction of monomer B, which keeps close contact with DNA in both conformations, is the dominant motion in the first mode. DNA limits the conformational flexibility of the system. (g and h) Positive-negative deviations from the native structure obtained in the second mode for simulations including DNA. In addition to monomer B, interaction of monomer A with DNA comes into the picture. Monomer A moves toward (g) and away (h) from DNA. Similar clamp-like motion is observed around DNA, opening/closing arm of the clamp being monomer A, which is known to have little positive correlation and hence minor contact with DNA. This characteristic motion of the dimer may enable a sliding mechanism along DNA.

Similar articles

Cited by

References

    1. el-Diery, W. S. 1998. Regulation of p53 downstream genes. Semin. Cancer Biol. 8:345–357. - PubMed
    1. Ryan, K. M., A. C. Phillips, and K. H. Vousden. 2001. Regulation and function of the p53 tumor suppressor protein. Curr. Opin. Cell Biol. 13:332–337. - PubMed
    1. Hofseth, L. J., S. P. Hussain, and C. C. Harris. 2004. p53: 25 years after its discovery. Trends Pharmacol. Sci. 25:117–181. - PubMed
    1. Donehower, L. A., M. Harvey, B. L. Slagle, M. J. McArthur, C. A. Montgomery, J. S. Butel, and A. Bradley. 1992. Mice deficient for p53 are developmentally normal but susceptible to spontaneous tumors. Nature. 356:215–221. - PubMed
    1. Hollstein, M., K. Rice, M. S. Greenblatt, T. Soussi, R. Fuchs, T. Sorlie, E. Hovig, B. Smith-Sorensen, R. Montesano, and C. C. Harris. 1994. Database of p53 gene somatic mutations in human tumors and cell lines. Nucleic Acids Res. 22:3551–3555. - PMC - PubMed

Publication types