. 2006 Jul 11;103(28):10729-34.
doi: 10.1073/pnas.0601956103. Epub 2006 Jun 28.

The dominant role of CD8+ dendritic cells in cross-presentation is not dictated by antigen capture

Affiliations

The dominant role of CD8+ dendritic cells in cross-presentation is not dictated by antigen capture

Petra Schnorrer et al. Proc Natl Acad Sci U S A. .

Abstract

Mouse spleens contain three populations of conventional (CD11c(high)) dendritic cells (DCs) that play distinct functions. The CD8(+) DC are unique in that they can present exogenous antigens on their MHC class I molecules, a process known as cross-presentation. It is unclear whether this special ability is because only the CD8(+) DC can capture the antigens used in cross-presentation assays, or because this is the only DC population that possesses specialized machinery for cross-presentation. To solve this important question we examined the splenic DC subsets for their ability to both present via MHC class II molecules and cross-present via MHC class I using four different forms of the model antigen ovalbumin (OVA). These forms include a cell-associated form, a soluble form, OVA expressed in bacteria, or OVA bound to latex beads. With the exception of bacterial antigen, which was poorly cross-presented by all DC, all antigenic forms were cross-presented much more efficiently by the CD8(+) DC. This pattern could not be attributed simply to a difference in antigen capture because all DC subsets presented the antigen via MHC class II. Indeed, direct assessments of endocytosis showed that CD8(+) and CD8(-) DC captured comparable amounts of soluble and bead-associated antigen, yet only the CD8(+) DC cross-presented these antigenic forms. Our results indicate that cross-presentation requires specialized machinery that is expressed by CD8(+) DC but largely absent from CD8(-) DC. This conclusion has important implications for the design of vaccination strategies based on antigen targeting to DC.


Conflict of interest statement

Conflict of interest statement: No conflicts declared.

Figures
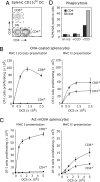
Fig. 1.
Fig. 1.
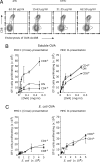
In vitro cross-presentation of cell-associated antigens by splenic DC subsets. (A) FACS analysis of a splenic DC preparation. The plot shows the expression of CD4 and CD8 in CD11c+ cells (≈70–80% of the total). Three populations can be distinguished: CD8+CD4 DC (CD8+ DC), CD8CD4+ DC (CD4+ DC), and CD8CD4 DC (DN DC). B220+ plasmacytoid DC were excluded from the DC preparation (44). (B) Purified spleen DC were cultured with irradiated OVA-coated bm1 splenocytes and naïve CFSE-labeled OT-I T cells (Left) or with OVA-coated MHC class II-deficient splenocytes and naïve CFSE-labeled OT-II T cells (Right). The number of proliferating (propidium iodide CFSElow) T cells was determined by FACS analysis at 60–65 h. All of the data point determinations were performed in duplicate. The error bars represent the range of the values obtained. The results shown are representative of multiple experiments. (C) Same as in B, but the source of OVA was splenocytes from act-mOVA mice backcrossed to bm1 mutant mice (presentation to OT-I cells; Left) or backcrossed to MHC class II-deficient mice (OT-II; Right). (D) Uptake of PKH26-labeled splenocytes by DC subsets. Sorted CD4+ (dark bars) or sorted CD8+ (light bars) DC were cultured for 3 h with γ-irradiated PKH26-labeled splenocytes on ice or at 37°C in the presence or absence of 10 μM cytochalasin D (CCD). The percentage of PKH26+ CD11c+ DC was then determined by flow cytometric analysis (Fig. 4). Data represent one experiment performed with sorted DC, but similar results were obtained in two experiments using unsorted DC.
Fig. 2.
Fig. 2.
Uptake and in vitro cross-presentation of soluble and bacterial antigens by splenic DC subsets. (A) Purified splenic DC were incubated with the indicated concentrations of OVA–Alexa Fluor 488 (OVA-Ax488) for 45 min at 4°C or 37°C. The cells were washed, labeled with antibodies for CD11c and CD8, and analyzed by flow cytometry. The plots show uptake of antigen by the CD8+ and CD8 DC subset. Endocytosis was measured as an increase in mean linear fluorescence in the FL1 channel. The results shown are representative of multiple experiments. (B) Sorted spleen DC subsets were pulsed with the indicated concentration of soluble OVA for 45 min, washed, and cocultured for 60–65 h with naïve OT-I cells (Left) or OT-II cells (Right). The number of proliferating T cells was then determined by FACS analysis. All determinations were obtained in duplicate; the error bars show the range of the values obtained. The results shown are representative of multiple experiments. (C) Sorted spleen DC subsets were cultured with the indicated number of paraformaldehyde-fixed OVA-expressing E. coli plus OT-I cells (Left) or OT-II cells (Right). The number of proliferating T cells was then determined by FACS analysis. All determinations were obtained in duplicate; the error bars show the range of the values obtained. The results shown are representative of four experiments.
Fig. 3.
Fig. 3.
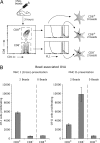
Cross-presentation of bead-associated antigen by splenic DC subsets. (A) Mice were injected i.v. with 200 μl of streptavidin-conjugated fluorescent latex beads that had been conjugated with biotinylated OVA (OVA-beads). Three hours later, spleens were removed and the DC were purified. Cells were stained with antibodies for CD11c and CD8. Preparative flow cytometry was then used to purify CD8+ and CD8 DC that had captured two beads and CD8+ DC that had not endocytosed any beads. (B) Splenic DC subsets were isolated as outlined in A and incubated with CFSE-labeled OT-I (Left) or OT-II (Right) T cells. The number of proliferating CFSElow T cells was determined by flow cytometry 60–65 h later. All determinations were performed in duplicate. The error bars indicate the range of the values obtained. Results shown are representative of three independent experiments.

References

    1. Wilson N. S., Villadangos J. A. Adv. Immunol. 2005;86:241–305. - PubMed
    1. Cresswell P., Ackerman A. L., Giodini A., Peaper D. R., Wearsch P. A. Immunol. Rev. 2005;207:145–157. - PubMed
    1. Touret N., Paroutis P., Terebiznik M., Harrison R. E., Trombetta S., Pypaert M., Chow A., Jiang A., Shaw J., Yip C., et al. Cell. 2005;123:157–170. - PubMed
    1. Shortman K., Liu Y. J. Nat. Rev. Immunol. 2002;2:151–161. - PubMed
    1. Villadangos J. A., Heath W. R. Semin. Immunol. 2005;17:262–272. - PubMed

Publication types

MeSH terms