. 2006 Jun 28;26(26):6945-57.
doi: 10.1523/JNEUROSCI.1382-06.2006.

Temperature-dependent shift of balance among the components of short-term plasticity in hippocampal synapses

Affiliations

Temperature-dependent shift of balance among the components of short-term plasticity in hippocampal synapses

Vitaly A Klyachko et al. J Neurosci. .

Abstract

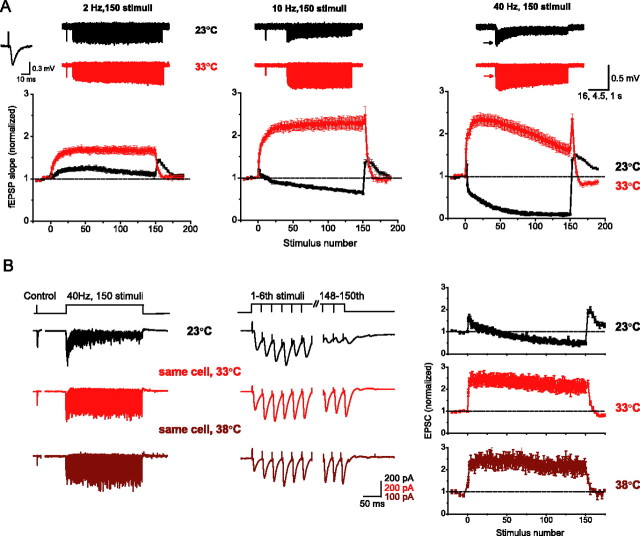
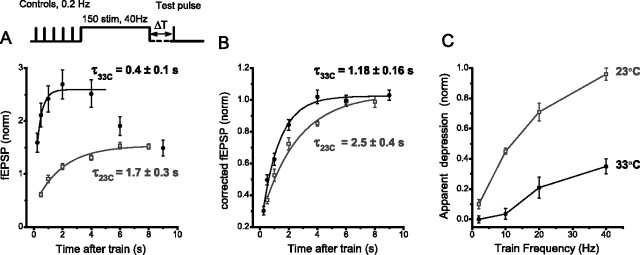
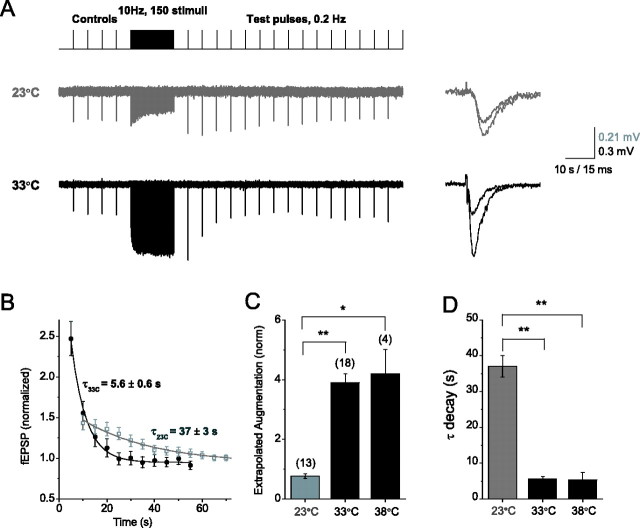
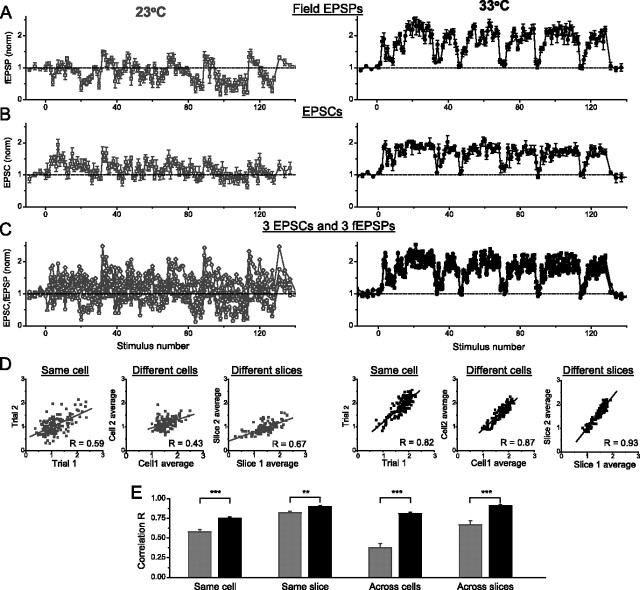
Studies of short-term plasticity (STP) in the hippocampus, performed mostly at room temperature, have shown that small central synapses rapidly depress in response to high-frequency stimulation. This decrease in synaptic strength with synapse use places constraints on the use of STP as a dynamic filter for processing of natural high-frequency input. Here we report that, because of a strong but differential temperature dependence of STP components, the properties of STP in excitatory hippocampal synapses change dramatically with temperature. By separating the contributions of various STP processes during spike trains at different temperatures, we found a shift from dominating depression at 23 degrees C to prevailing facilitation and augmentation at 33-38 degrees C. This shift of balance among STP components resulted from a large increase in amplitudes of facilitation and augmentation (Q10 approximately 2.6 and approximately 5.1, respectively) and little change in the amplitude of depression (Q10 approximately 1.1) with temperature. These changes were accompanied by the accelerated decay of all three processes (Q10 = 3.2, 6.6, and 2.1, respectively). The balance of STP components achieved at higher temperatures greatly improved the maintenance of synaptic strength during prolonged synaptic use and had a strong effect on the processing of natural spike trains: a variable mixture of facilitated and depressed responses at 23 degrees C changed into a significantly more reproducible and depression-free filtering pattern at 33-38 degrees C. This filtering pattern was highly conserved among cells, slices, and animals, and under various physiological conditions, arguing for its physiological significance. Therefore, the fine balance among STP components, achieved only at near body temperatures, is required for the robust function of STP as a dynamic filter during natural stimulation.


Figures

Figure 1.
Figure 1.
Temperature-dependent shift from depression to potentiation. A, Top, Representative examples of raw fEPSP train responses at 23°C (black) and at 33°C (red) evoked by 150-stimulus trains at 2, 10, and 40 Hz. For presentation only, traces were downsampled, and the baseline drifts were corrected as described in Materials and Methods. The last control fEPSP, recorded at 0.1–0.2 Hz immediately preceding each train, is shown for 2 and 10 Hz trains or indicated by an arrow for 40 Hz trains. Bottom, Average normalized initial fEPSP slopes (here and throughout) are plotted versus stimulus number in the train for 2, 10, and 40 Hz (n = 9–16 slices). Inset, An example of a typical fEPSP. B, An example of whole-cell EPSC responses evoked in a CA1 pyramidal neuron by 40 Hz, 150-stimulus trains at 23°C (black traces), 33°C (red traces), and 38°C (brown traces) (left panels). The first six and the last three EPSCs from each train are shown on an expanded timescale for each temperature (middle panels). Average EPSC amplitudes at 23, 33, and 38°C (n = 11 cells) are plotted versus stimulus number for each temperature (right panels).
Figure 2.
Figure 2.
Separation of STP components. Complex response to constant-frequency stimulation (representative fEPSP response to 20 Hz, 150 stimuli is shown) resulted from the interplay of at least three major forms of STP: facilitation (F), augmentation (AUG), and depression (DEP). During the train (shown on an expanded timescale), all components were present simultaneously, and their contributions were difficult to identify. Because of different time courses of decay, however, various components became unmasked at different times after the end of stimulation. Facilitation, which decayed first with a time course of approximately hundreds of milliseconds, was studied separately with a paired-pulse protocol. The second most rapidly decaying process, recovery from DEP, dominated the synaptic response almost immediately after the end of the train [250 ms to 6 s (500 ms to 8 s at 23°C)]. Finally, ∼5 s (∼10 s at 23°C) after the end of the train, AUG remained the last major STP component, because contributions from rapidly decaying F and DEP became insignificant. We took advantage of this time-based separation of STP components and traced their contributions backward, starting with the slower one. Parameters of the slower components were used in turn to compensate, where necessary, for their contributions to the mixture with the faster components, assuming a multiplicative relationship among the components of potentiation and depression (see Materials and Methods).
Figure 3.
Figure 3.
Recovery from depression is much faster at near physiological temperatures. A, Single test pulses at different time intervals (0.25–8 s) after the end of 150-stimuli, 40 Hz train revealed a rapid recovery from depression [at 23°C (□); at 33°C (•); here and throughout], partly obscured by decaying facilitation and augmentation. B, Parameters of overlapping components of potentiation were determined from monoexponential fits calculated in each slice, and their contributions to synaptic response during the decay of depression were compensated, assuming a multiplicative relationship among these components. Contributions from the slow component of depression (τ ∼50–60 s) to the time course of recovery from depression were negligible and were not compensated for in these experiments. C, The accumulation of apparent depression during 150-stimulus trains at different frequencies (2–40 Hz) was estimated as a difference between the maximal response and the minimal response during the train, normalized by the maximal response.
Figure 4.
Figure 4.
Facilitation increased in amplitude and decayed much faster at 33–38°C. A, Facilitation was measured at 23°C (□) and 33°C (•) with a paired-pulse protocol at 10–1000 ms intervals. Inset, Representative paired-pulse fEPSPs at 23 and 33°C. B, C, Extrapolated amplitude (B) and the time course of decay (C) of facilitation at 23, 33, and 38°C. Facilitation was more than two times larger and decayed approximately three times faster at body temperature. Parameters of facilitation did not vary significantly between 33 and 38°C. ∗∗p < 0.01; ∗∗∗p < 0.001.
Figure 5.
Figure 5.
Augmentation increased greatly in amplitude and decayed much faster at 33–38°C. A, Augmentation was monitored with test pulses at 0.2 Hz after a 150-stimulus train at 10 Hz. This stimulation protocol was insufficient to evoke the slow component of depression (see Results); therefore, in the selected time window, reported changes in the synaptic strength were associated with pure augmentation. Representative examples of raw fEPSP responses are shown on the top for 23°C (gray) and 33°C (black) with 15 test pulses after the end of stimulation reflecting the decay of augmentation. For presentation only, the raw traces of train responses were downsampled, and the baseline drifts were subtracted as described in Materials and Methods. Examples of single control and augmented fEPSPs (first test response after each train) are shown on the right for each temperature. B, Average augmentation at 23°C (□) and 33°C (•), measured as shown in A. C, D, The amplitude of augmentation extrapolated to t = 0 (C) and the time course of decay (D) at 23, 33, and 38°C. Augmentation was approximately five times larger and decayed approximately seven times faster at 33°C than at 23°C (p < 10−5 for both). Parameters of augmentation did not change significantly with heating from 33 to 38°C (p > 0.37 for both). ∗p < 0.05; ∗∗p < 0.01.
Figure 6.
Figure 6.
Differential transition points in the temperature dependence of STP components. Extrapolated amplitudes (top panels) and time constants (bottom panels) of facilitation (A), augmentation (B), and depression (C) were determined as described in Figures 3–5 in a range of temperatures from 23 to 38°C. The transition points in the temperature dependence were determined with a sigmoidal Boltzmann equation fit.
Figure 7.
Figure 7.
Improved maintenance of synaptic strength during sustained stimulation at higher temperatures. Synaptic responses to trains of different duration (green traces, 25 stimuli; red traces, 50 stimuli; blue traces, 150 stimuli; cyan traces, 300 stimuli) at 10 Hz (A, B) and 40 Hz (C, D) were recorded to evaluate the ability to maintain synaptic strength during prolonged synaptic use at near body temperatures (n = 5). Representative fEPSP responses to 300-stimulus trains at 10 Hz (A) or 40 Hz (C) at 33°C are shown on the top, and the average normalized fEPSP slopes for 10 Hz (B) and 40 Hz (D) trains are plotted below. The raw traces were processed for presentation only as described in Materials and Methods.
Figure 8.
Figure 8.
Implications for processing of natural stimulation patterns. A, A representation of a natural stimulation pattern with each line depicting a spike (top). fEPSP responses to natural spike patterns (initial slope as a function of time) at 23°C (gray trace, top) and 33°C (black trace, middle) from the same slice and at 38°C from a different slice (black trace, bottom). Each point was an average of four to five train presentations, and each presentation was separated by at least 2 min of controls at 0.1 Hz. The response changed dramatically with heating from 23 to 33°C in the same slice but remained the same at 33 and 38°C even between different slices. B, At 33°C, the response to natural stimulation was the same in the more physiological 1 mm [Ca2+]o as it was in 2 mm [Ca2+]o. C, Changes in synaptic strength during presentation of the same natural stimulation pattern are plotted point by point versus each other for two different conditions: 23°C versus 33°C (unscaled pattern, top); 23°C (pattern scaled ×3; see Results) versus 33°C (middle); 38°C versus 33°C (bottom). The R value was determined with linear regression. D, Same as C, but for 1 mm [Ca2+]o at 33°C versus 2 mm [Ca2+]o at 33°C.
Figure 9.
Figure 9.
Temperature-dependent shift in reproducibility of synaptic responses to natural stimulus patterns. A, The same fEPSP recordings as shown in Figure 8A are plotted versus stimulus number rather than time for 23°C (left panel) and 33°C (right panel). B, An example of whole-cell responses to the same natural stimulation pattern as in A, recorded in two different CA1 neurons at 23°C (left) and 33°C (right). Note that whole-cell and fEPSP recordings were made in animals of different ages (14–25 d old for whole-cell and 21–35 d old for fEPSPs). C, Three whole-cell and three fEPSP recordings at 23°C (left) or 33°C (right) are overlaid to emphasize the shift in reproducibility of synaptic responses with temperature. D, Correlation analysis, performed as described in Figure 8, C and D, showed that responses at 23°C were much more variable among different cells or slices than within single cells or slices, respectively. At 33°C, synaptic responses were highly conserved within cells or slices, as well as across different cells, slices, and animals. E, Average correlation coefficient for data in D. Gray bars, 23°C; black bars, 33°C. ∗∗p < 0.01; ∗∗∗p < 0.001.

References

    1. Abbott LF, Regehr WG (2004). Synaptic computation. Nature 431:796–803. - PubMed
    1. Abbott LF, Varela JA, Sen K, Nelson SB (1997). Synaptic depression and cortical gain control. Science 275:220–224. - PubMed
    1. Blaustein MP, Lederer WJ (1999). Sodium/calcium exchange: its physiological implications. Physiol Rev 79:763–854. - PubMed
    1. Bolshakov VY, Siegelbaum SA (1995). Regulation of hippocampal transmitter release during development and long-term potentiation. Science 269:1730–1734. - PubMed
    1. Brager DH, Capogna M, Thompson SM (2002). Short-term synaptic plasticity, simulation of nerve terminal dynamics, and the effects of protein kinase C activation in rat hippocampus. J Physiol (Lond) 541:545–559. - PMC - PubMed

LinkOut - more resources