. 2006 Jun 28;26(26):7035-45.
doi: 10.1523/JNEUROSCI.1012-06.2006.

Mitochondrial trafficking to synapses in cultured primary cortical neurons

Affiliations

Mitochondrial trafficking to synapses in cultured primary cortical neurons

Diane T W Chang et al. J Neurosci. .

Abstract

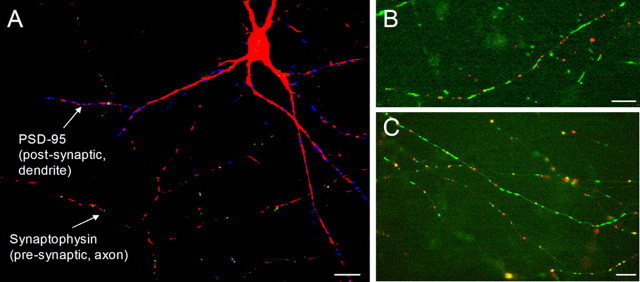
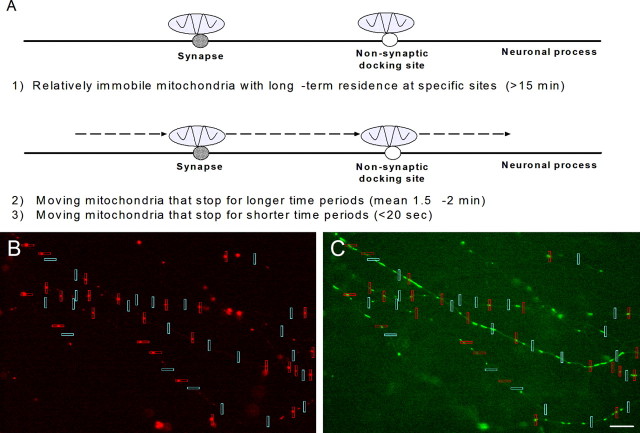
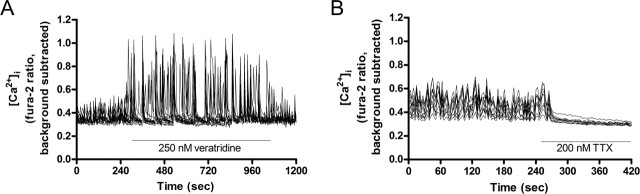
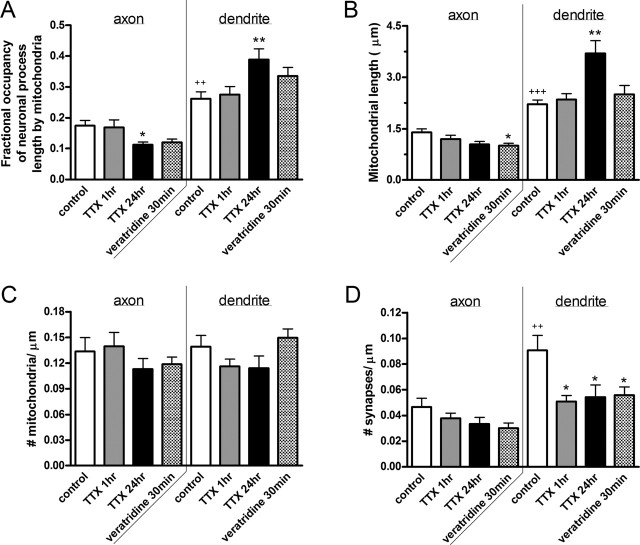
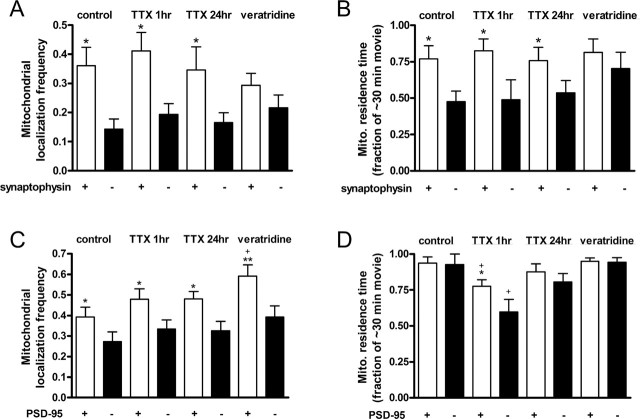
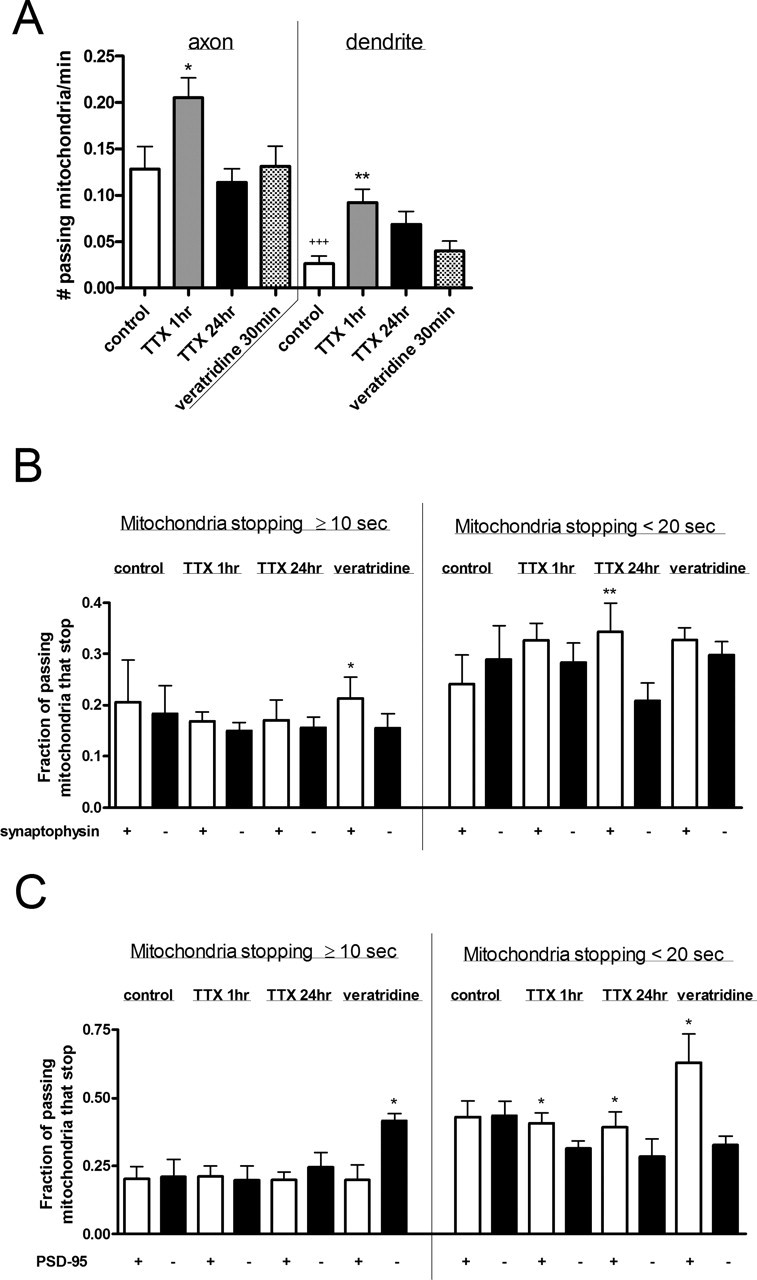
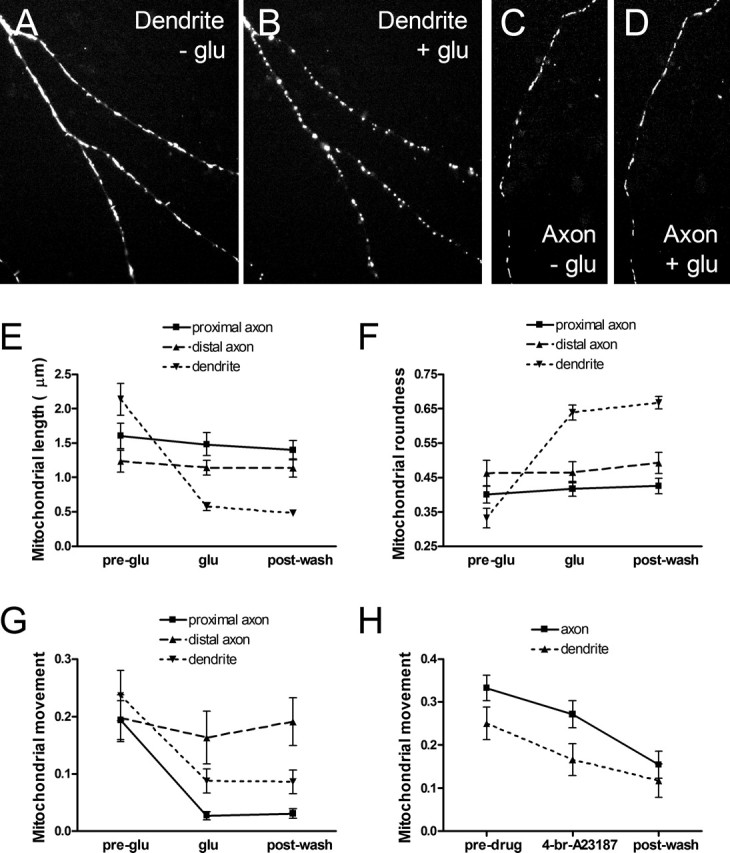
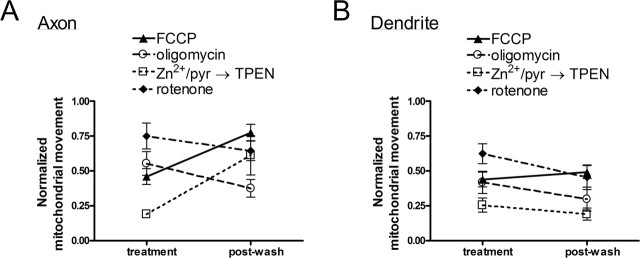
Functional synapses require mitochondria to supply ATP and regulate local [Ca2+]i for neurotransmission. Mitochondria are thought to be transported to specific cellular regions of increased need such as synapses. However, little is known about how this occurs, including the spatiotemporal distribution of mitochondria relative to presynaptic and postsynaptic sites, whether mitochondria are dynamically recruited to synapses, and how synaptic activity affects these trafficking patterns. We used primary cortical neurons in culture that form synaptic connections and show spontaneous synaptic activity under normal conditions. Neurons were cotransfected with a mitochondrially targeted cyan fluorescent protein and an enhanced yellow fluorescent protein-tagged synaptophysin or postsynaptic density-95 plasmid to label presynaptic or postsynaptic structures, respectively. Fluorescence microscopy revealed longer dendritic mitochondria that occupied a greater fraction of neuronal process length than axonal mitochondria. Mitochondria were significantly more likely to be localized at synaptic sites. Although this localization was unchanged by inhibition of synaptic activity by tetrodotoxin, it increased in dendritic synapses and decreased in axonal synapses during overactivity by veratridine. Mitochondrial movement and recruitment to synapses also differed between axons and dendrites under basal conditions and when synaptic activity was altered. Additionally, we show that movement of dendritic mitochondria can be selectively impaired by glutamate and zinc. We conclude that mitochondrial trafficking to synapses is dynamic in neurons and is modulated by changes in synaptic activity. Furthermore, mitochondrial morphology and distribution may be optimized differentially to best serve the synaptic distributions in axons and dendrites. Last, selective cessation of mitochondrial movement in dendrites suggests early postsynaptic dysfunction in neuronal injury and degeneration.


Figures

Figure 1.
Figure 1.
Mitochondrial localization and trafficking were visualized relative to presynaptic and postsynaptic sites by cotransfecting neurons with fluorescent proteins. A, Primary cortical neuron transfected with mito-CFP (red), presynaptic label synaptophysin–eYFP (green), and postsynaptic label PSD-95–mRFP (blue). B, Dendritic segment from a transfected neuron showing mito-CFP-labeled mitochondria (green) and PSD-95–eYFP clusters (red). C, Axonal branches from a transfected neuron showing mito-CFP-labeled mitochondria (green) and synaptophysin–eYFP clusters (red). Images are representative of three to five cultures. Scale bars, 10 μm.
Figure 2.
Figure 2.
Populations of mitochondria with different movement patterns were observed, and their trafficking patterns were analyzed in a blinded manner. A, Mitochondria that were relatively immobile tended to remain stationary at synaptic and nonsynaptic sites for >15 min. Relatively mobile mitochondria exhibited saltatory movement, making stops at synaptic and nonsynaptic sites for shorter or longer time periods. B, Representative axonal image prepared for blinded data analysis shows ROIs placed around synaptophysin clusters (red boxes) and ROIs placed at nonsynaptic locations (blue boxes). C, Corresponding mitochondrial image with ROIs, shown here before box colors were made uniform, was used to measure the localization and trafficking parameters listed in Table 1. Scale bar, 10 μm.
Figure 3.
Figure 3.
Spontaneous synaptic activity of cultured neurons was pharmacologically modulated to determine the effects on mitochondrial trafficking. A, Spontaneous [Ca2+]i fluxes in the cell somas of all neurons in an imaging field measured by fura-2 AM were indicative of basal synaptic activity and were amplified in magnitude by 250 nm veratridine. B, [Ca2+]i spiking was inhibited by 200 nm TTX. Traces represent 10–13 cells from a single coverslip. Experiments were repeated two to three times each on three separate cultures.
Figure 4.
Figure 4.
Mitochondrial distribution and morphology differed between axons and dendrites and was differentially modulated by changes in synaptic activity. A, Mitochondrial occupancy of axons was significantly lower than that of dendrites. This was measured as the total length of all mitochondria divided by the length of all neuronal processes in a given field. Treatment with 1 μm TTX for 24 h or 250 nm veratridine for 30 min reduced mitochondrial occupancy of axons but increased occupancy of dendrites. B, Mitochondrial length was significantly shorter in axons than in dendrites. Treatment with TTX for 24 h increased mitochondrial length in dendrites. Veratridine also reduced mitochondrial length in axons. C, Number of mitochondria per micrometer of neuronal process was similar between axons and dendrites and was not affected by changes in synaptic activity. D, Significantly more stationary clusters of PSD-95 populated dendrites compared with synaptophysin clusters on axons. TTX and veratridine treatments reduced the number of stationary PSD-95 clusters. Values are shown as mean ± SE from two to three coverslips each from four to five separate cultures. p < 0.05 was considered significant, in which + represents comparisons between axons and dendrites of untreated cells, and ∗ represents comparisons between untreated cells and pharmacologically treated cells.
Figure 5.
Figure 5.
Mitochondria localized significantly to presynaptic and postsynaptic sites, and their distribution relative to synapses changed in response to altered synaptic activity. A, Mitochondrial localization frequency to presynaptic sites was measured as the fraction of synaptophysin clusters that contained mitochondria (white bars) compared with the fraction of randomly selected sites void of synaptophysin clusters that contained mitochondria (black bars). Mitochondria localized preferentially to synaptophysin clusters in untreated and TTX-treated cells but not in veratridine-treated cells. B, Residence times of the mitochondria localized to synaptic and nonsynaptic sites in A were compared. Residence time was calculated as the length of time that the colocalized mitochondria remained stationary divided by the duration time of the imaging movie. Mitochondria resided significantly longer at synaptophysin clusters than nonsynaptic sites in untreated and TTX-treated cells but not veratridine-treated cells. C, Mitochondrial localization frequency at PSD-95 clusters was measured as in A. Mitochondria localized preferentially to PSD-95 clusters, and veratridine treatment increased this localization frequency relative to untreated cells. D, Residence time of mitochondria at PSD-95 clusters was measured as described in B. Treatment with 200 nm TTX for 1 h reduced mitochondrial residence times in dendrites, yet mitochondria resided at PSD-95 clusters longer than at nonsynaptic sites. Values are shown as mean ± SE from two to three coverslips each from three to five separate cultures. p < 0.05 was considered significant, in which ∗ represents comparisons between synaptic sites and nonsynaptic sites in the same cells, and + represents comparisons between untreated cells and pharmacologically treated cells.
Figure 6.
Figure 6.
Mitochondrial movement patterns differed between axons and dendrites and was altered in response to changes in synaptic activity. A, Mitochondrial movement was greater in axons than dendrites and was increased in all processes by 1 h treatment with 200 nm TTX. Movement was measured as the number of mitochondria passing a given point on a neuronal process over time. B, The fraction of passing mitochondria measured in A that paused at synaptophysin clusters (white bars) on axons was compared with the fraction that paused at nonsynaptic sites (black bars). Mitochondria that stopped for at least two imaging frames, equivalent to ≥10 s (mean 1.5 min), showed a preference toward synaptophysin clusters after 30 min treatment with 250 nm veratridine. Mitochondria that stopped for one imaging frame, equivalent to <20 s, showed a preference toward synaptophysin clusters after 24 h treatment with 1 μm TTX. C, The fraction of passing mitochondria measured in A that paused at PSD-95 clusters (white bars) on dendrites was compared with the fraction that paused at nonsynaptic sites (black bars). Mitochondria that stopped for at least two imaging frames, equivalent to ≥10 s (mean of 2 min), showed a preference toward PSD-95 clusters after veratridine treatment. Mitochondria that stopped for one imaging frame, equivalent to <20 s, showed a preference toward nonsynaptic sites after TTX and veratridine treatments. Values are shown as mean ± SE from two to three coverslips each from three to five separate cultures. p < 0.05 was considered significant. In A, + represents comparisons between axons and dendrites of untreated cells, and ∗ represents comparisons between untreated cells and pharmacologically treated cells. In B and C, ∗ represents comparisons between synaptic sites and nonsynaptic sites in the same cells.
Figure 7.
Figure 7.
Acute treatment with excitotoxic glutamate concentrations caused remodeling of mitochondrial morphology solely in dendrites and cessation of mitochondrial movement in dendrites and proximal axon segments. A, B, Dendritic mitochondria displayed morphological remodeling and are shown before and after a 10 min treatment with 30 μm glutamate (glu)/1 μm glycine. C, D, Axonal mitochondria did not demonstrate morphological remodeling and are shown before and after glutamate treatment. E, Mitochondrial length shortened in dendrites but not axons after glutamate treatment. No recovery was observed after a 10 min wash. F, Mitochondria rounded selectively in dendrites after glutamate treatment with no recovery after a 10 min wash. G, Mitochondrial movement (measured as average event count/average number of mitochondrial pixels) in dendrites and proximal axon segments decreased significantly after glutamate treatment but was unaffected in distal axon segments. H, Mitochondrial movement was reduced in all neuronal processes when [Ca2+]i was uniformly increased by a 5 min treatment with 1 μm 4-Br-A23187, a Ca2+ ionophore. Note that the difference in mitochondrial morphology precludes the absolute values for axonal and dendritic movement to be compared by our measurement technique in G and H. Also, movement values should not be compared between G and H because images were acquired at different rates. Values are shown as mean ± SE from two to three coverslips each from three to four separate cultures. p < 0.05 was considered significant.
Figure 8.
Figure 8.
Axonal and dendritic mitochondrial movement were equally susceptible to cessation after FCCP, oligomycin, rotenone, and zinc exposures, but only axonal mitochondria acutely recovered movement after washout of FCCP and chelation of zinc. A, Mitochondrial movement (measured as average event count/average number of mitochondrial pixels) in axons significantly recovered 15 min after depolarization with 5 min 750 nm FCCP treatment and 20 min after exposure to 10 min 3 μm ZnCl2/20 μm Na-pyrithione (pyr) treatment followed by chelation with 5 min 25 μm TPEN. Movement did not recover after 10 min treatment with 10 μm oligomycin or 5 min treatment with 2 μm rotenone. B, Mitochondrial movement in dendrites did not acutely recover after treatment with FCCP, oligomycin, or zinc/pyrithione followed by TPEN. Movement continued to decrease significantly in dendrites 20 min after rotenone was washed out. Values were normalized to mitochondrial movement before treatment and are shown as mean ± SE from two to six coverslips each from two to four separate cultures. p < 0.05 was considered significant.

References

    1. Billups B, Forsythe ID (2002). Presynaptic mitochondrial calcium sequestration influences transmission at mammalian central synapses. J Neurosci 22:5840–5847. - PMC - PubMed
    1. Bindokas VP, Lee CC, Colmers WF, Miller RJ (1998). Changes in mitochondrial function resulting from synaptic activity in the rat hippocampal slice. J Neurosci 18:4570–4587. - PMC - PubMed
    1. Bossy-Wetzel E, Barsoum MJ, Godzik A, Schwarzenbacher R, Lipton SA (2003). Mitochondrial fission in apoptosis, neurodegeneration and aging. Curr Opin Cell Biol 15:706–716. - PubMed
    1. Briones TL, Suh E, Jozsa L, Rogozinska M, Woods J, Wadowska M (2005). Changes in number of synapses and mitochondria in presynaptic terminals in the dentate gyrus following cerebral ischemia and rehabilitation training. Brain Res 1033:51–57. - PubMed
    1. Cai Q, Gerwin C, Sheng Z-H (2005). Syntabulin-mediated anterograde transport of mitochondria along neuronal processes. J Cell Biol 170:959–969. - PMC - PubMed

Publication types

LinkOut - more resources