. 2006 Jun 28;26(26):7046-55.
doi: 10.1523/JNEUROSCI.1235-06.2006.

Lateral diffusion drives constitutive exchange of AMPA receptors at dendritic spines and is regulated by spine morphology

Affiliations

Lateral diffusion drives constitutive exchange of AMPA receptors at dendritic spines and is regulated by spine morphology

Michael C Ashby et al. J Neurosci. .

Abstract

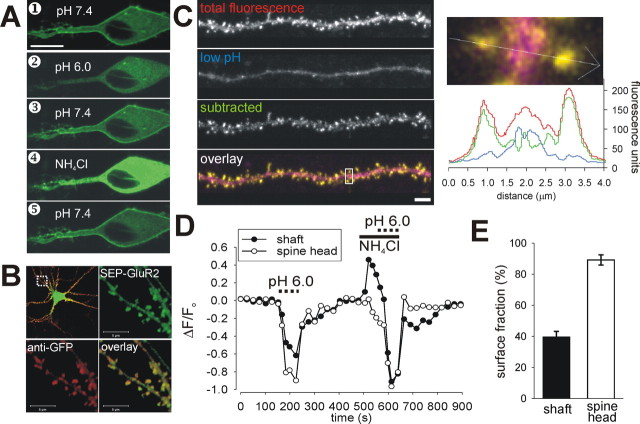
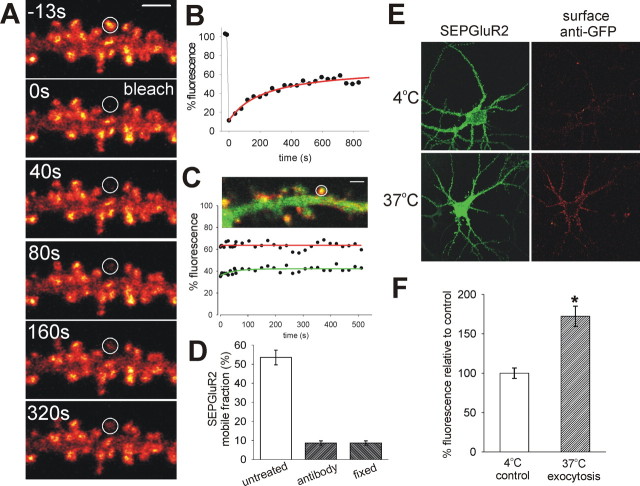
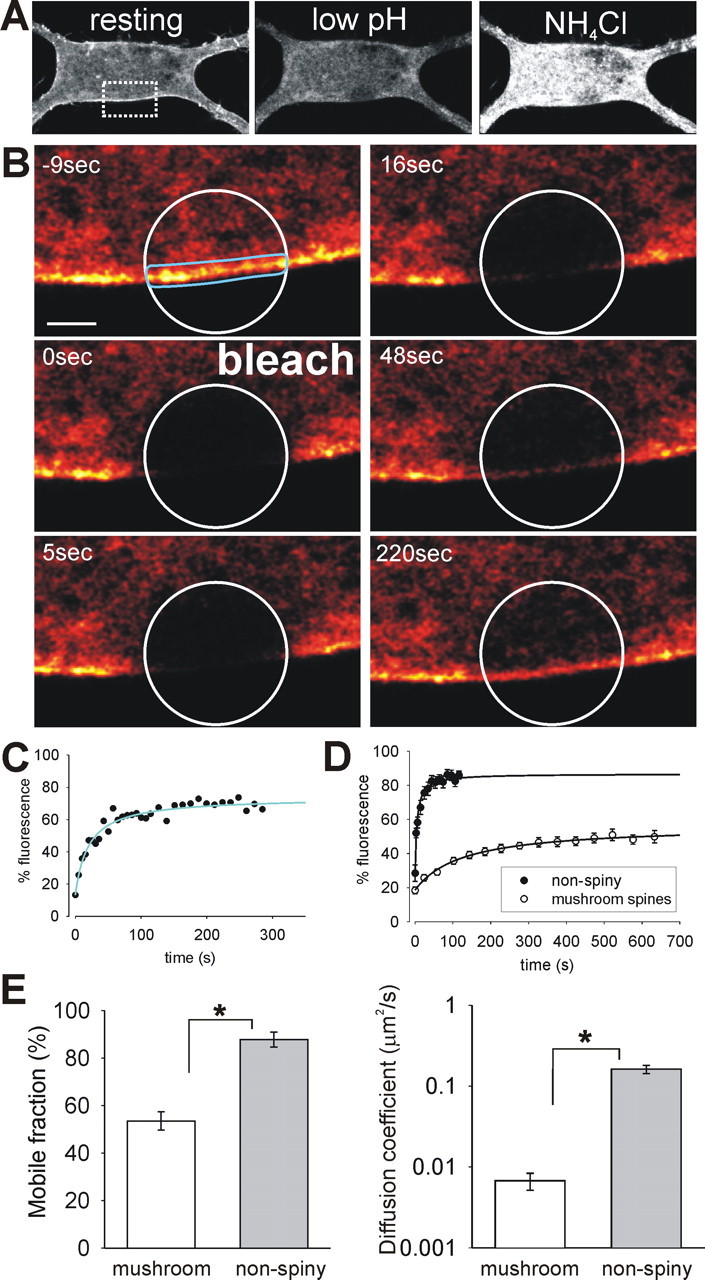
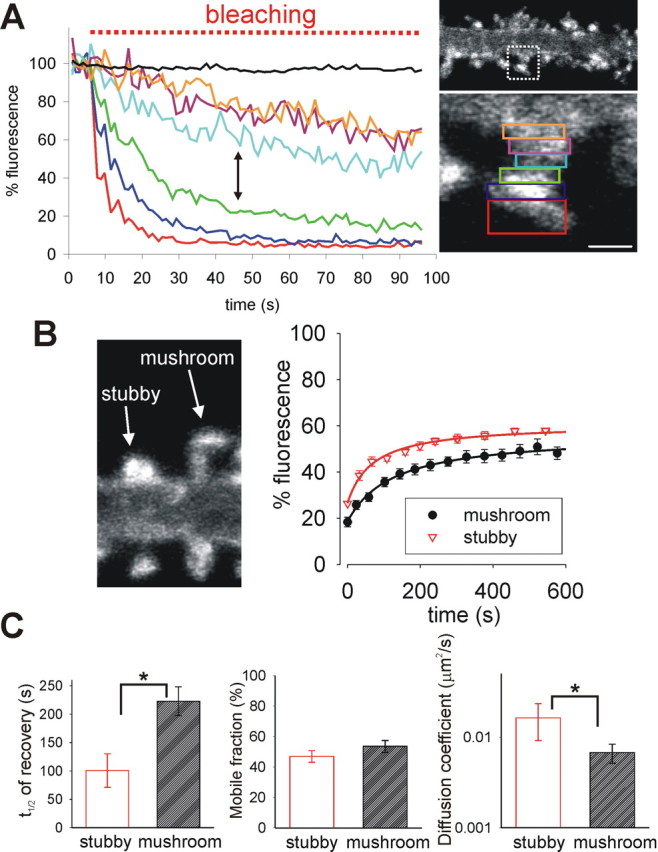
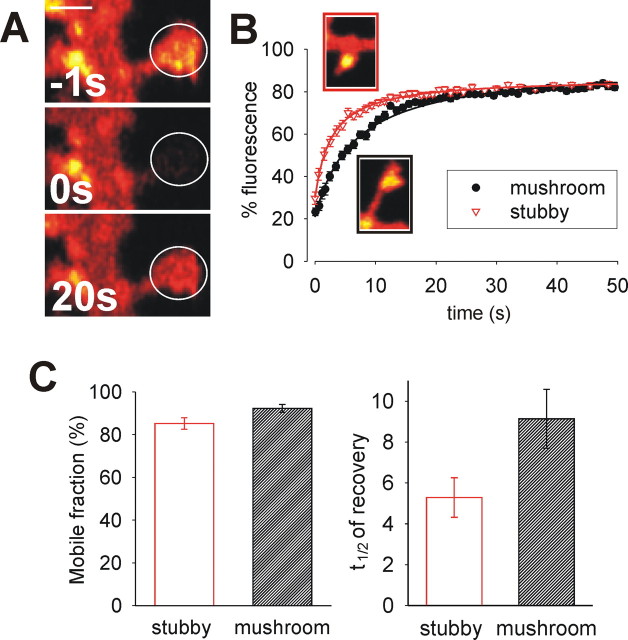
Synapse specificity is a basic feature of synaptic plasticity, but it remains unclear how synapse-specific signaling is achieved if postsynaptic membrane proteins can diffuse laterally between synapses. We monitored movements of AMPA receptors (AMPARs) on the surface of mature neurons to investigate the role of lateral diffusion in constitutive AMPAR trafficking and to assess the influence of membrane architecture on the surface distribution of synaptic proteins. Our data show that lateral diffusion is responsible for the continual exchange of a substantial pool of AMPARs at the spine surface. Furthermore, we found that a general characteristic of membrane proteins is that their movement into and out of spines is slow compared with that in nonspiny membrane. This shows that lateral diffusion is dependent on spine morphology and is restricted at the spine neck. These results demonstrate the importance of lateral diffusion in trafficking of AMPAR protein population and provide new insight into how spine structure can maintain synapse specificity by compartmentalizing lateral diffusion and therefore increasing the residence time of membrane proteins near individual synapses.


Figures

Figure 1.
Figure 1.
SEP–GluR2 fluorescence allows specific observation of AMPARs on the surface of neurons. A, Single confocal images of SEP–GluR2 fluorescence in the cell body and proximal dendrites of a cultured hippocampal neuron. At rest (image 1), there is bright fluorescence from the edges of the cell, dim fluorescence inside the cell body, and little in the nucleus. Low pH wash reversibly expunges the surface fluorescence (image 2), and NH4Cl reveals the total fluorescence (image 4) by alkalinizing the cell interior. B, Images of SEP–GluR2 (green) and surface anti-GFP antibody (red) distribution. High-magnification images (from dashed area in top left image) show the similar distributions of fluorescence in spiny dendrites. C, The left panel contains reconstructed confocal image stacks of a spiny hippocampal dendrite showing total SEP–GluR2 fluorescence and that from surface (subtracted) and internal (during pH 6.0 wash) AMPARs. In the overlay image, yellow (red/green colocalization) indicates surface, and pink (red/blue colocalization) indicates internal fluorescent AMPARs. The right panel shows fluorescence profile across selected spines and dendritic shaft. Note that SEP–GluR2 fluorescence in spine heads comes almost exclusively from surface AMPARs. Fluorescence distribution was checked in this way in every experiment. D, Representative trace showing changes in SEP–GluR2 fluorescence in spines and shafts during application of pH 6.0 or NH4Cl-containing buffer. Note that spine fluorescence is much more dependent on changes in extracellular pH, whereas shaft fluorescence is more sensitive to intracellular alkalinization. E, Histogram showing the proportion of SEP–GluR2 on the neuronal cell surface in spine heads and dendritic shafts (mean ± SEM; n = 10). In spines, a much larger proportion of the total SEP–GluR2 is on the surface. Scale bars: A, 10 μm; B, C, 5 μm.
Figure 2.
Figure 2.
FRAP of SEP–GluR2 shows that AMPARs continually move in and out of the dendritic spine plasma membrane by lateral diffusion rather than constitutive exocytosis. A, Glow-scale images from experimental time course showing that photobleached AMPARs on the surface of spine heads (in white circle) are constitutively exchanged for fluorescent AMPARs. Scale bar, 3 μm. B, Normalized FRAP curve from spine head showing partial recovery of fluorescence after photobleaching over the course of 13 min as bleached AMPARs are exchanged with unbleached AMPARs. The data are fitted with a Brownian diffusion model of recovery (red line). C, Representative time course of representative experiment showing that FRAP (and thus AMPAR exchange) is blocked by preincubation by red-labeled anti-GFP antibody that cross-links surface receptors and thus limits lateral diffusion. D, Histogram showing mean ± SEM mobile fraction of SEP–GluR2 in spine heads under normal conditions, after cross-linking anti-GFP antibody treatment, and after fixation. Cross-linking of surface AMPARs reduces recovery to the same level as cell fixation. E, Constitutive exocytosis of SEP–GluR2-containing AMPARs after preincubation with anti-GFP antibody. Fluorescence images show cells expressing SEP–GluR2 (green) that have been preincubated with unlabeled anti-GFP antibody. Red fluorescence is from surface Alexa 594-labeled anti-GFP antibody (red) after a 15 min period at either 4°C or 37°C. F, Mean ± SEM surface anti-GFP fluorescence normalized to control (4°C). ∗p = 0.0004.
Figure 3.
Figure 3.
Lateral movement of AMPARs in and out of spines is much slower than movement along nonspiny membrane. A, SEP–GluR2 fluorescence image shows single confocal image of region of cell to be bleached. The bright edge of the cell is sensitive to low pH wash and so comes from AMPARs in the plasma membrane. Alkalinizing the cell with NH4Cl reveals the full fluorescence of internal AMPARs. B, SEP–GluR2 fluorescence (glow scale) FRAP images from nonspiny membrane region shown in dashed box on image in A. Bleaching of SEP–GluR2 fluorescence (in white circle) is followed by rapid recovery of fluorescence along the membrane from the edges of bleach region toward the center. Scale bar, 1 μm. C, Graph shows normalized FRAP curve from membrane region (fitted with diffusion model; blue line). D, Pooled and averaged (mean ± SEM) FRAP curves from mushroom spines and nonspiny regions of membrane. The extent and rate of recovery is greatly reduced in spine heads. E, Averaged mobile fractions and diffusion coefficients for spine and nonspiny membranes. The proportion of mobile AMPARs is larger and the speed of diffusion of mobile AMPARs is much faster in nonspiny areas (mean ± SEM; ∗p < 0.0001).
Figure 4.
Figure 4.
There is a barrier to AMPAR lateral movement located at the spine neck. A, Continuous photobleaching at the top of the spine head (red region) leads to loss of fluorescence in nearby regions (regions shown in accompanying image; the black line is fluorescence in neighboring spine) as SEP–GluR2 moves around the membrane of the spine. The loss of fluorescence is relatively slow in regions at or near the neck, suggesting that movement in this region is reduced. Scale bar, 1 μm. B, Image shows typical examples of SEP–GluR2 fluorescence from stubby and mushroom spines. Chart shows pooled and averaged FRAP curves from stubby and mushroom spine heads. C, Histograms showing the means ± SEM of t1/2, mobile fraction, and diffusion coefficients from stubby and mushroom spine heads. Mobile fractions are similar (p = 0.37) but the time needed for recovery is reduced in spines that do not have necks, and this is reflected in a faster rate of diffusion (∗p < 0.05).
Figure 5.
Figure 5.
Diffusion in the plasma membrane of spines is nonspecifically compartmentalized. A, Fluorescence images (glow scale) of memGFP during a typical FRAP experiment. There is rapid recovery of fluorescence after photobleaching in the spine head (white circle). Scale bar, 1 μm. B, Pooled and averaged FRAP curves for memGFP in stubby (black) and mushroom (red) spines. Images show representative spines from the two groups. Note the more rapid recovery in stubby spine plasma membrane. C, Averaged mobile fractions in the two regions are the same, but the mean t1/2 of recovery is longer in mushroom spines (mean ± SEM).

Comment in

References

    1. Adesnik H, Nicoll RA, England PM (2005). Photoinactivation of native AMPA receptors reveals their real-time trafficking. Neuron 48:977–985. - PubMed
    1. Ashby MC, Ibaraki K, Henley JM (2004a). It's green outside: tracking cell surface proteins with pH-sensitive GFP. Trends Neurosci 27:257–261. - PubMed
    1. Ashby MC, De La Rue SA, Ralph GS, Uney J, Collingridge GL, Henley JM (2004b). Removal of AMPA receptors (AMPARs) from synapses is preceded by transient endocytosis of extrasynaptic AMPARs. J Neurosci 24:5172–5176. - PMC - PubMed
    1. Axelrod D, Koppel DE, Schlessinger J, Elson E, Webb WW (1976). Mobility measurement by analysis of fluorescence photobleaching recovery kinetics. Biophys J 16:1055–1069. - PMC - PubMed
    1. Blanpied TA, Scott DB, Ehlers MD (2002). Dynamics and regulation of clathrin coats at specialized endocytic zones of dendrites and spines. Neuron 36:435–449. - PubMed

Publication types

LinkOut - more resources