. 2006 Nov;96(5):2327-41.
doi: 10.1152/jn.00326.2006. Epub 2006 Jun 28.

Phase locking of auditory-nerve fibers to the envelopes of high-frequency sounds: implications for sound localization

Affiliations

Phase locking of auditory-nerve fibers to the envelopes of high-frequency sounds: implications for sound localization

Anna Dreyer et al. J Neurophysiol. 2006 Nov.

Abstract

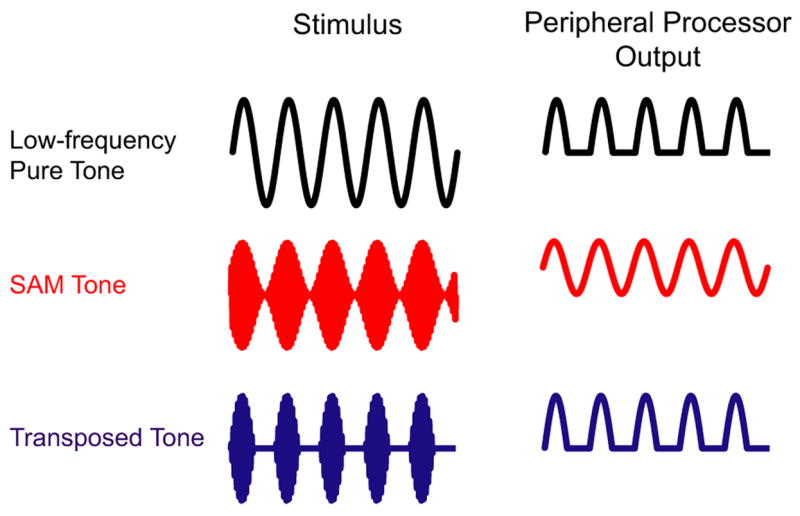
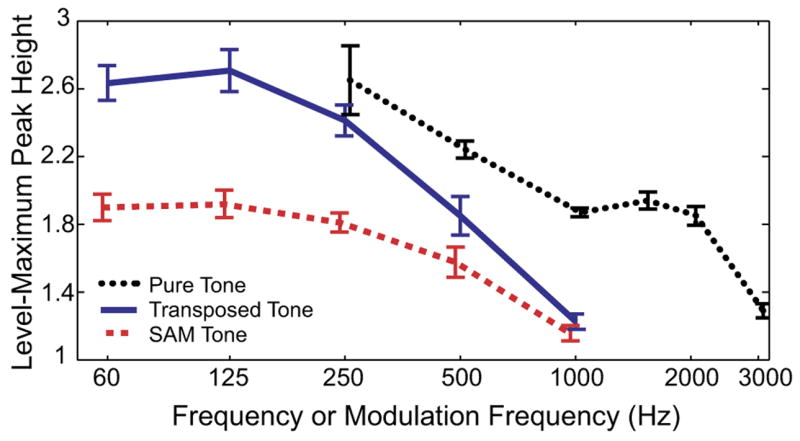
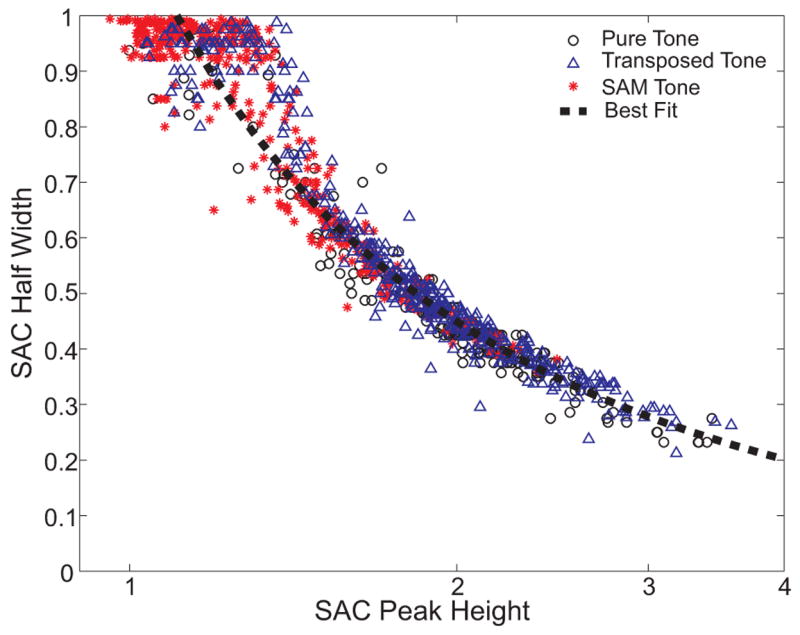
Although listeners are sensitive to interaural time differences (ITDs) in the envelope of high-frequency sounds, both ITD discrimination performance and the extent of lateralization are poorer for high-frequency sinusoidally amplitude-modulated (SAM) tones than for low-frequency pure tones. Psychophysical studies have shown that ITD discrimination at high frequencies can be improved by using novel transposed-tone stimuli, formed by modulating a high-frequency carrier by a half-wave-rectified sinusoid. Transposed tones are designed to produce the same temporal discharge patterns in high-characteristic frequency (CF) neurons as occur in low-CF neurons for pure-tone stimuli. To directly test this hypothesis, we compared responses of auditory-nerve fibers in anesthetized cats to pure tones, SAM tones, and transposed tones. Phase locking was characterized using both the synchronization index and autocorrelograms. With both measures, phase locking was better for transposed tones than for SAM tones, consistent with the rationale for using transposed tones. However, phase locking to transposed tones and that to pure tones were comparable only when all three conditions were met: stimulus levels near thresholds, low modulation frequencies (<250 Hz), and low spontaneous discharge rates. In particular, phase locking to both SAM tones and transposed tones substantially degraded with increasing stimulus level, while remaining more stable for pure tones. These results suggest caution in assuming a close similarity between temporal patterns of peripheral activity produced by transposed tones and pure tones in both psychophysical studies and neurophysiological studies of central neurons.


Figures

Fig. 1
Fig. 1
Acoustic waveforms and hypothetical outputs of the peripheral auditory processor for a pure tone, a sinusoidally amplitude-modulated (SAM) tone, and a transposed tone. (Adapted from Bernstein 2001.)
Fig. 2
Fig. 2
A: period histograms as a function of stimulus level for a pure tone, a SAM tone, and a transposed tone. Pure-tone responses (black squares) are from a low characteristic frequency (CF, 344 Hz), medium spontaneous rate (SR) fiber (SR = 2 spikes/s and threshold of 28 dB SPL) using a frequency near the CF (354 Hz). Responses to SAM (red triangles) and transposed (blue circles) tones are from a high-CF (7,000 Hz), medium-SR fiber (5.2 spikes/s and threshold 20 dB SPL) using a carrier at the CF and a modulation frequency of 250 Hz. Stimulus waveforms are shown at the bottom on a normalized timescale. B: synchronization index calculated from the period histograms as a function of level with respect to rate threshold for the 3 stimuli. C: average discharge rate as a function of level with respect to rate threshold.
Fig. 3
Fig. 3
Synchronization index (SI) as a function of level with respect to rate threshold in response to pure tones (black dotted), transposed tones (blue solid), and SAM tones (red dashed) for entire data set presented at the CF. Only pure-tone responses <1,000 Hz are included. For each stimulus type, a bold line was drawn using the mean values of the slope, maximum SI, and SPL of maximum SI from the best linear fit to each SI-level function.
Fig. 4
Fig. 4
A: maximum values of synchronization index (SImax) over all levels as a function of frequency or modulation frequency for pure tones (dotted black), transposed tones (solid blue), and SAM tones (dashed red). Error bars represent ±1 SE. B: mean slopes of SI-level functions (expressed in dB−1) as a function of modulation frequency. In both panels, pure-tone responses are binned to the closest frequency shown.
Fig. 5
Fig. 5
SI vs. level functions for 4 modulation frequencies. Each panel shows responses and best-fitting line (bold) to SAM (dashed red) and transposed (solid blue) tones for one modulation frequency. Best-fit lines are computed using same method as in Fig. 3.
Fig. 6
Fig. 6
SImax values over all levels as a function of frequency or modulation frequency for pure tones, transposed tones, and SAM tones differentiated by high-SR (dashed lines) and low/medium-SR (solid lines) groups of fibers. Error bars represent ±1 SE.
Fig. 7
Fig. 7
A: period histograms to transposed tones (fm = 250 Hz) with carrier frequencies (fc) below, on, and above the CF as a function of stimulus levels. Carrier frequencies were 5,603 Hz (below-CF, light blue), 6,920 Hz (on-CF, blue), and 7,490 Hz (above-CF, green). Fiber CF = 6,920 Hz, SR = 1.0 spikes/s, threshold at CF = 31 dB SPL. B: synchrony level functions derived from period histograms for each carrier frequency. Level is expressed relative to rate threshold at fc. SI value for lowest level on-CF response is not shown because it did not reach statistical significance. C: rate level functions.
Fig. 8
Fig. 8
Comparison of slope of synchrony level functions off CF and on CF. A, top and bottom: SI vs. level expressed with respect to level maximum of each SI-level function. Three colors represent responses to fc on CF (dashed black), above CF (solid magenta), and below CF (dotted green). B, top and bottom: change in SI (ΔSI) level functions relative to on-CF condition for fc above (solid magenta) and below CF (dotted green). ΔSI-level curves are obtained by binning level axis for the synchrony level functions in A in 5-dB steps and subtracting the on-CF response from the off-CF response for each level.
Fig. 9
Fig. 9
A: shuffled autocorrelograms (SACs) as a function of stimulus level in response to a pure tone (black squares), SAM tone (red triangles), and a transposed tone (blue circles). Figure is based on the same data as in Fig. 2. B: normalized autocorrelation peak height vs. sound level with respect to rate threshold for the 3 stimuli. C: normalized autocorrelation half-width against sound level with respect to rate threshold for the 3 stimuli.
Fig. 10
Fig. 10
Normalized SAC peak height (see METHODS) against SI for all recordings in response to low-frequency pure tones (black), transposed tones (blue), and SAM tones (red). Only pure-tone frequencies <1,000 Hz are included. Best-fitting hyperbolic curves (solid lines) were fit separately to pure-tone data and to combined SAM and transposed tone data.
Fig. 11
Fig. 11
Maximum SAC peak heights across all levels as a function of frequency or modulation frequency for pure tones (black dotted), transposed tones (blue solid), and SAM tones (red dashed). Error bars represent ±1 SE. Pure-tone responses are binned to the closest frequency shown.
Fig. 12
Fig. 12
SAC peak height against normalized half-width for all low-frequency pure tone (black circles), transposed tone (blue triangles), and SAM tone (red asterisks) data. Solid line shows the best-fitting hyperbolic function (see RESULTS) for the entire data set.

References

    1. Anderson DJ, Rose JE, Hind JE, Brugge JF. Temporal position of discharges in single auditory nerve within the cycle of a sine-wave stimulus: frequency and intensity effects. J Acoust Soc Am. 1971;49:1131–1139. - PubMed
    1. Ashmore JF. The electrophysiology of hair cells. Ann Rev Physiol. 1991;53:465–476. - PubMed
    1. Batra R, Kuwada S, Stanford TR. High-frequency neurons in the inferior colliculus that are sensitive to interaural delays of amplitude-modulated tones: evidence for dual binaural influences. J Neurophysiol. 1993;70:64–80. - PubMed
    1. Bernstein LR. Auditory processing of interaural timing information: new insights. J Neurosci Res. 2001;66:1035–1046. - PubMed
    1. Bernstein LR, Trahiotis C. Lateralization of low-frequency, complex waveforms: the use of envelope-based temporal disparities. J Acoust Soc Am. 1985;77:1868–1880. - PubMed

Publication types

LinkOut - more resources