

Application of the method of fundamental solutions to potential-based inverse electrocardiography
- PMID: 16807788
- PMCID: PMC2440514
- DOI: 10.1007/s10439-006-9131-7
Application of the method of fundamental solutions to potential-based inverse electrocardiography
Abstract
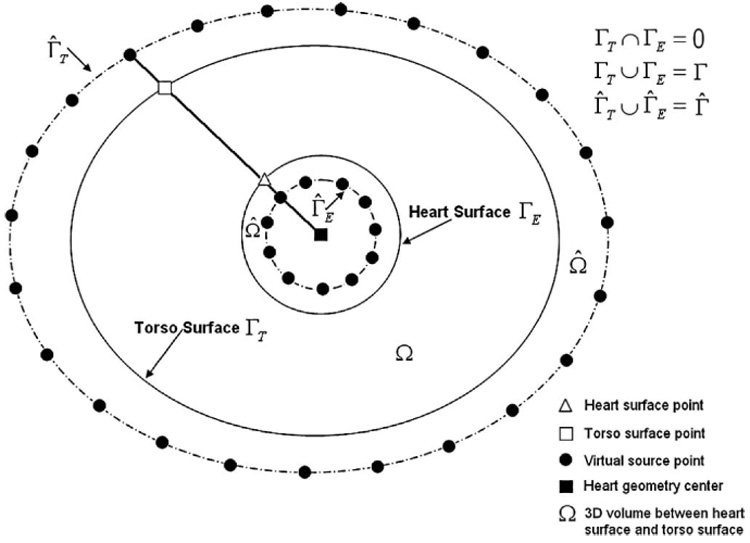
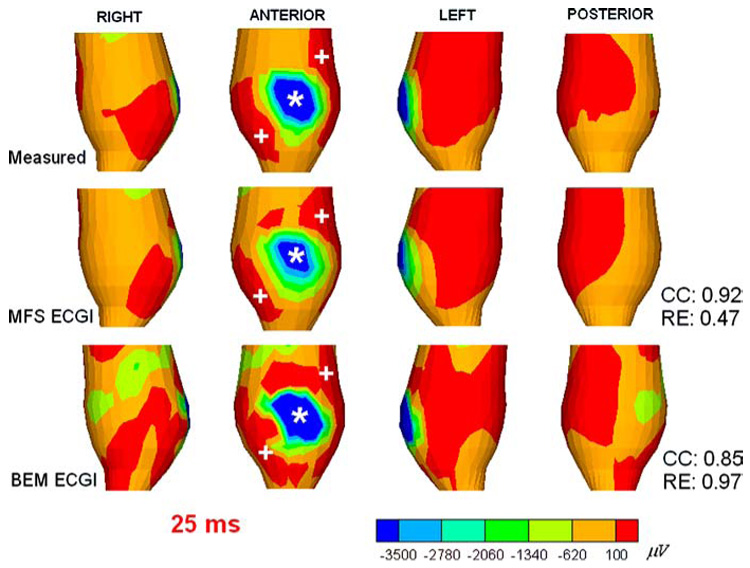
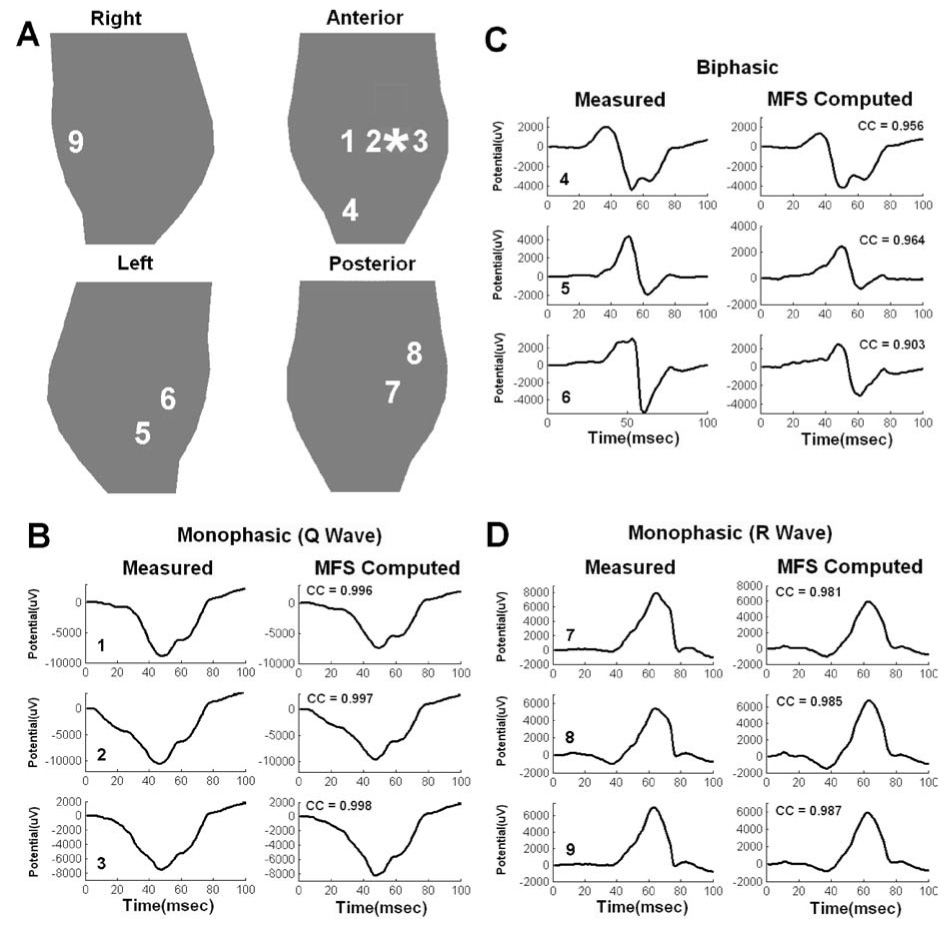
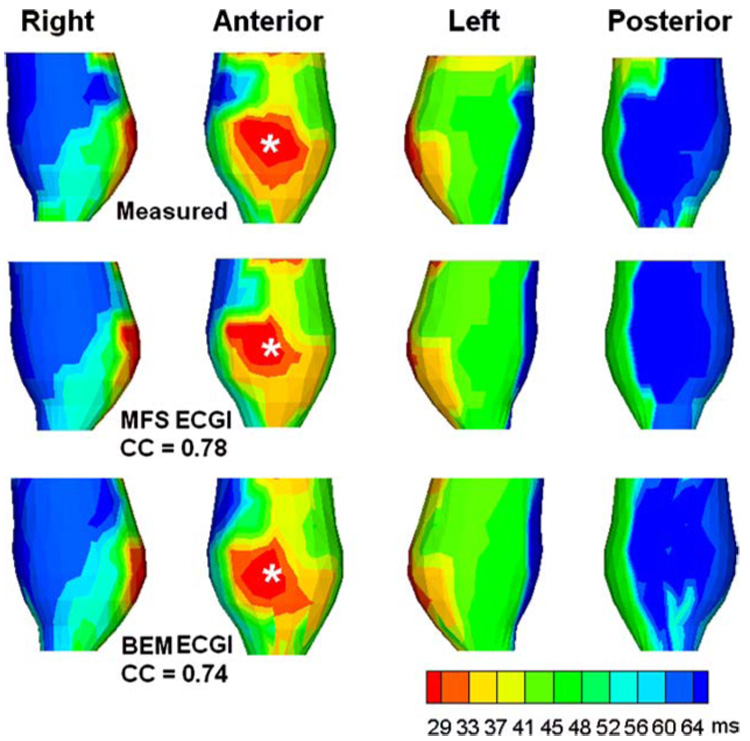
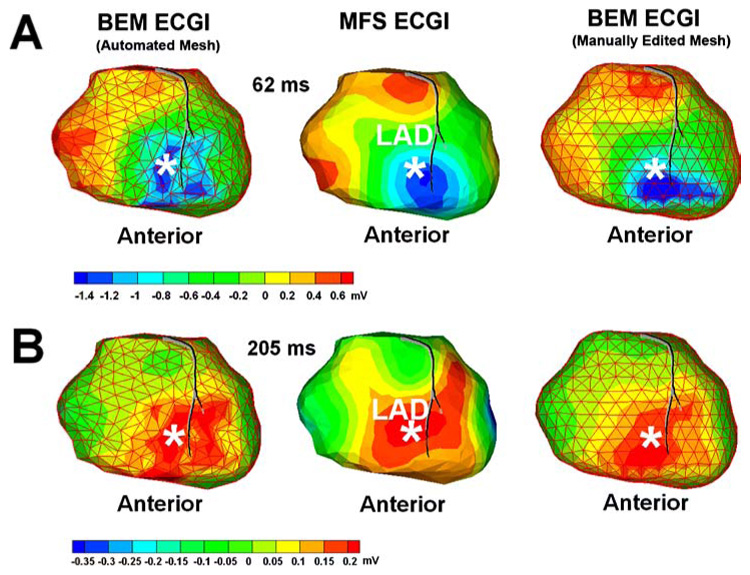
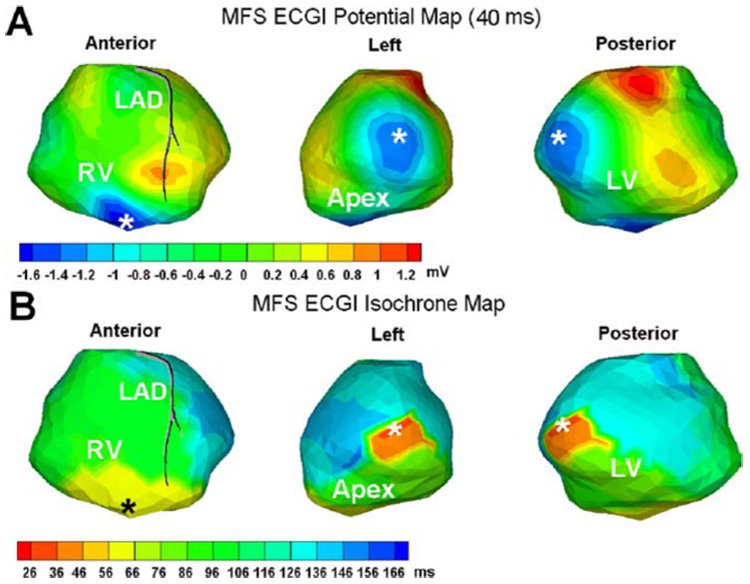
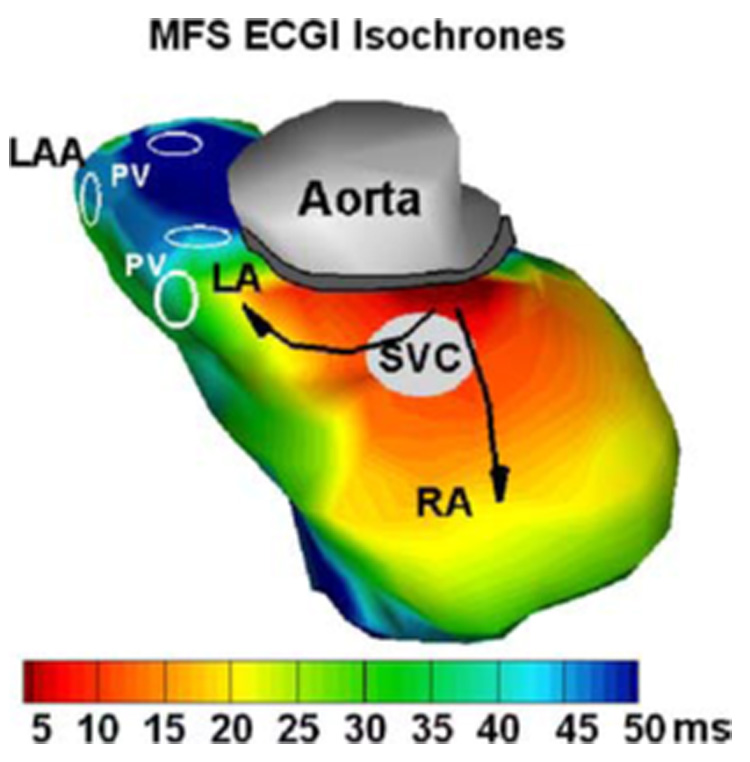
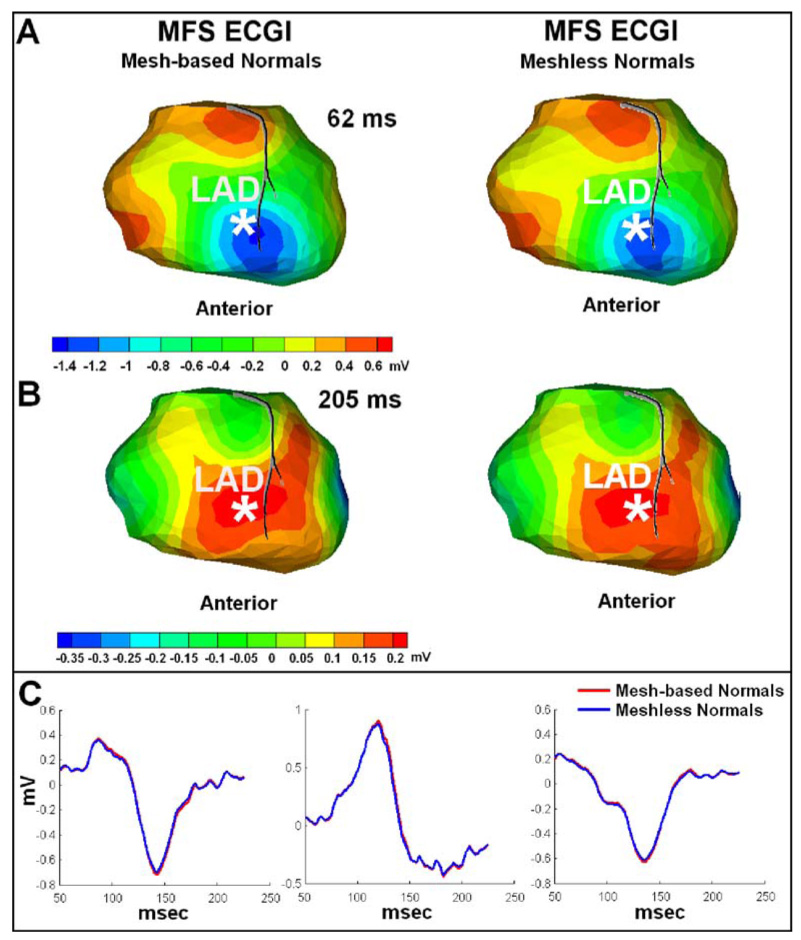
Potential-based inverse electrocardiography is a method for the noninvasive computation of epicardial potentials from measured body surface electrocardiographic data. From the computed epicardial potentials, epicardial electrograms and isochrones (activation sequences), as well as repolarization patterns can be constructed. We term this noninvasive procedure Electrocardiographic Imaging (ECGI). The method of choice for computing epicardial potentials has been the Boundary Element Method (BEM) which requires meshing the heart and torso surfaces and optimizing the mesh, a very time-consuming operation that requires manual editing. Moreover, it can introduce mesh-related artifacts in the reconstructed epicardial images. Here we introduce the application of a meshless method, the Method of Fundamental Solutions (MFS) to ECGI. This new approach that does not require meshing is evaluated on data from animal experiments and human studies, and compared to BEM. Results demonstrate similar accuracy, with the following advantages: 1. Elimination of meshing and manual mesh optimization processes, thereby enhancing automation and speeding the ECGI procedure. 2. Elimination of mesh-induced artifacts. 3. Elimination of complex singular integrals that must be carefully computed in BEM. 4. Simpler implementation. These properties of MFS enhance the practical application of ECGI as a clinical diagnostic tool.
Figures
Similar articles
-
Meshless methods in potential inverse electrocardiography.Conf Proc IEEE Eng Med Biol Soc. 2006;2006:2558-9. doi: 10.1109/IEMBS.2006.259645. Conf Proc IEEE Eng Med Biol Soc. 2006. PMID: 17946965
-
Noninvasive electrocardiographic imaging (ECGI): application of the generalized minimal residual (GMRes) method.Ann Biomed Eng. 2003 Sep;31(8):981-94. doi: 10.1114/1.1588655. Ann Biomed Eng. 2003. PMID: 12918913 Free PMC article.
-
Electrocardiographic imaging: II. Effect of torso inhomogeneities on noninvasive reconstruction of epicardial potentials, electrograms, and isochrones.J Cardiovasc Electrophysiol. 2001 Feb;12(2):241-52. doi: 10.1046/j.1540-8167.2001.00241.x. J Cardiovasc Electrophysiol. 2001. PMID: 11232625
-
The inverse problem of bioelectricity: an evaluation.Med Biol Eng Comput. 2012 Sep;50(9):891-902. doi: 10.1007/s11517-012-0941-5. Epub 2012 Jul 28. Med Biol Eng Comput. 2012. PMID: 22843426 Review.
-
An expert review of the inverse problem in electrocardiographic imaging for the non-invasive identification of atrial fibrillation drivers.Comput Methods Programs Biomed. 2023 Oct;240:107676. doi: 10.1016/j.cmpb.2023.107676. Epub 2023 Jun 10. Comput Methods Programs Biomed. 2023. PMID: 37343376 Review.
Cited by
-
Electrocardiographic imaging in the atria.Med Biol Eng Comput. 2023 Apr;61(4):879-896. doi: 10.1007/s11517-022-02709-7. Epub 2022 Nov 12. Med Biol Eng Comput. 2023. PMID: 36370321 Free PMC article. Review.
-
Intracardiac Inverse Potential Mapping Using the Method of Fundamental Solutions.Front Physiol. 2022 May 16;13:873049. doi: 10.3389/fphys.2022.873049. eCollection 2022. Front Physiol. 2022. PMID: 35651876 Free PMC article.
-
Effect of Segmentation Uncertainty on the ECGI Inverse Problem Solution and Source Localization.Comput Cardiol (2010). 2022 Sep;49:10.22489/cinc.2022.275. doi: 10.22489/cinc.2022.275. Epub 2023 Apr 3. Comput Cardiol (2010). 2022. PMID: 37786732 Free PMC article.
-
A Common-Ground Review of the Potential for Machine Learning Approaches in Electrocardiographic Imaging Based on Probabilistic Graphical Models.Comput Cardiol (2010). 2018 Sep;45:10.22489/CinC.2018.348. doi: 10.22489/CinC.2018.348. Comput Cardiol (2010). 2018. PMID: 30899763 Free PMC article.
-
Quantifying and Visualizing Uncertainty for Source Localization in Electrocardiographic Imaging.Comput Methods Biomech Biomed Eng Imaging Vis. 2023;11(3):812-822. doi: 10.1080/21681163.2022.2113824. Epub 2022 Sep 12. Comput Methods Biomech Biomed Eng Imaging Vis. 2023. PMID: 37284179 Free PMC article.
References
-
- Atkinson KE, Chien D. Piecewise Polynomial collocation for boundary integral equations. SIAM J. Sci. Stat. Comput. 1995;16:651–681.
-
- Barr RC, Spach MS. Inverse calculation of QRS-T epicardial potentials from body surface potential distributions for normal and ectopic beats in the intact dog. Circ. Res. 1978;42(5):661–675. - PubMed
-
- Barr RC, Spach MS. Inverse solutions directly in terms of potentials. In: Nelson CV, Geselowitz DB, editors. The Theoretical Basis of Electrocardiography. Oxford: Clarendon Press; 1976. pp. 294–304.
-
- Batdorf M, Freitag LA, Ollivier-Gooch C. Computational study of the effect of unstructured mesh quality on solution efficiency; Proc. 13th AIAA Computational Fluid Dynamics Conf.: 1888; 1997.
-
- Beer G, Watson JO. Introduction to Finite and Boundary Element Methods for Engineers. West Sussex: Wiley; 1992.
Publication types
MeSH terms
Grants and funding
LinkOut - more resources
Full Text Sources
Other Literature Sources
