. 2006 Sep 15;575(Pt 3):693-705.
doi: 10.1113/jphysiol.2006.113910. Epub 2006 Jun 29.

Sodium-calcium exchange does not require allosteric calcium activation at high cytosolic sodium concentrations

Affiliations

Sodium-calcium exchange does not require allosteric calcium activation at high cytosolic sodium concentrations

Jason Urbanczyk et al. J Physiol. .

Abstract

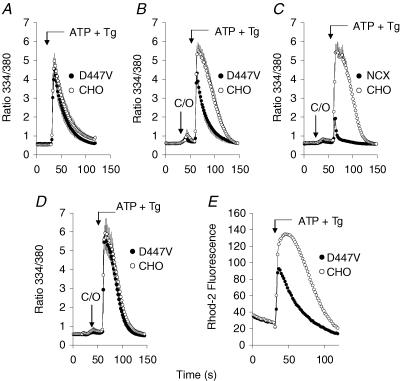
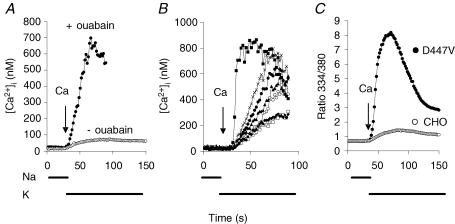
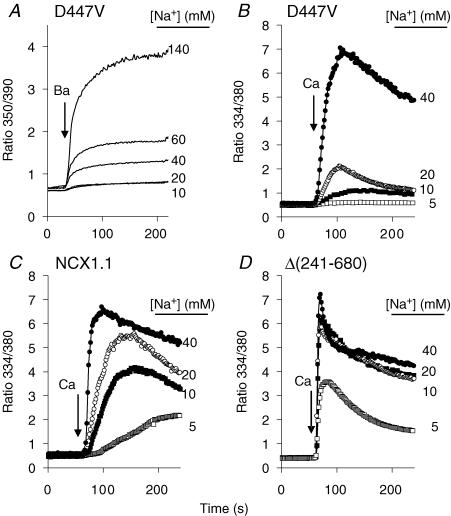
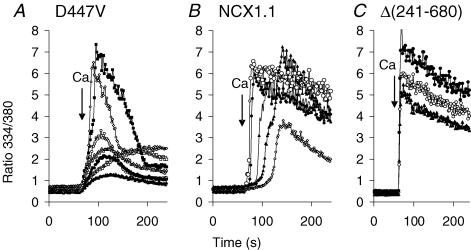
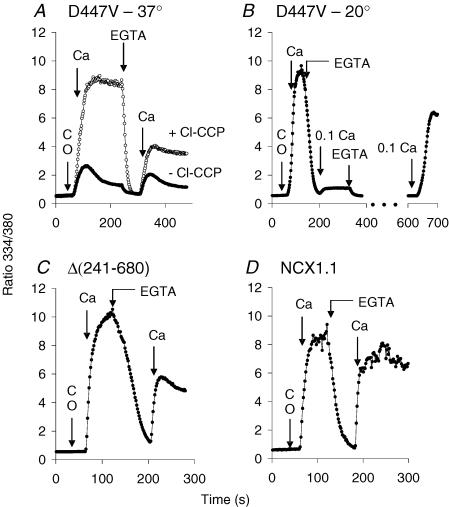
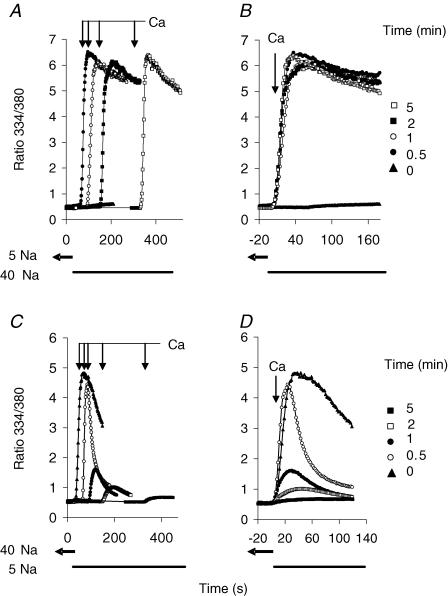
The activity of the cardiac Na(+)-Ca(2+) exchanger (NCX1.1) is allosterically regulated by Ca(2+), which binds to two acidic regions in the cytosolically disposed central hydrophilic domain of the NCX protein. A mutation in one of the regulatory Ca(2+) binding regions (D447V) increases the half-activation constant (K(h)) for allosteric Ca(2+) activation from approximately 0.3 to > 1.8 microm. Chinese hamster ovary cells expressing the D447V exchanger showed little or no activity under physiological ionic conditions unless cytosolic [Ca(2+)] was elevated to > 1 microm. However, when cytosolic [Na(+)] was increased to 20 mm or more (using ouabain-induced inhibition of the Na(+),K(+)-ATPase or the ionophore gramicidin), cells expressing the D447V mutant rapidly accumulated Ca(2+) or Ba(2+) when the reverse (Ca(2+) influx) mode of NCX activity was initiated, although initial cytosolic [Ca(2+)] was < 100 nm. Importantly, the time course of Ca(2+) uptake did not display the lag phase that reflects allosteric Ca(2+) activation of NCX activity in the wild-type NCX1.1; indeed, at elevated [Na(+)], the D447V mutant behaved similarly to the constitutively active deletion mutant Delta(241-680), which lacks the regulatory Ca(2+) binding sites. In cells expressing wild-type NCX1.1, increasing concentrations of cytosolic Na(+) led to a progressive shortening of the lag phase for Ca(2+) uptake. The effects of elevated [Na(+)] developed rapidly and were fully reversible. The activity of the D447V mutant was markedly inhibited when phosphatidylinositol 4,5-bisphosphate (PIP2) levels were reduced. We conclude that when PIP2 levels are high, elevated cytosolic [Na(+)] induces a mode of exchange activity that does not require allosteric Ca(2+) activation.


Figures

Figure 1
Figure 1. Ca2+ efflux in cells expressing the D447V mutant
Non-transfected CHO cells and cells expressing the D447V mutant (A, B, D and E) or wild-type canine exchanger (C) were grown together on the same coverslip and loaded with fura-2. Immediately before beginning the recordings, the coverslips were washed with Na-PSS containing 0.3 mm EGTA (Na-PSS/EGTA). A, ATP (100 μm) and Tg (2 μm) in Na-PSS/EGTA were applied to release Ca2+ from the ER (n = 6 coverslips; vertical bars denote s.e.m.). B, as in A except that 1 ml of Na-PSS/EGTA containing 5 μm Cl-CCP and 1 μg ml−1 oligomycin (arrow labelled C/O) was applied 30 s prior to adding ATP and Tg in Na-PSS/EGTA containing 5 μm Cl-CCP (n = 5). C, as in B except that the experiment was carried out with cells expressing the wild-type NCX1.1 instead of the D447V mutant (n = 3). D, as in B except that the experiment was carried out in a Na+-free medium (K-PSS; n = 4). E, cells were loaded with rhod-2 as described in the Methods. Application of ATP and Tg was in Na-PSS/EGTA, and mitochondrial Ca2+ uptake was monitored as an increase rhod-2 fluorescence.
Figure 2
Figure 2. Ca2+ uptake in ouabain-treated cells
A, 10 min before beginning recordings, cells were treated with ATP and Tg in Na-PSS/EGTA with (•) or without 1 mm ouabain (○). Activity of NCX was initiated by applying 0.1 mm CaCl2 in K-PSS as indicated. The traces represent the average responses of 60 cells from single coverslips. B, traces from several of the individual ouabain-treated cells from the experiment shown in A. C, coverslips containing a mixture of D447V and non-transfected CHO cells were treated with ATP and Tg in Na-PSS/EGTA for 15 min before beginning recordings. Activity of NCX was initiated by applying 0.1 mm CaCl2 in K-PSS as indicated. The peak ratio in this experiment (∼8) was much higher than the peak ratio observed for the experiment in A (∼2), most probably because of the increased incubation time with ouabain. The trace represents the average response of 44 D447V cells and 20 CHO cells from a single cover slip.
Figure 3
Figure 3. Ca2+ and Ba2+ uptake in gramicidin-treated cells
Cells expressing the D447V mutant were treated with ATP and Tg in Na-PSS/EGTA 10 min before beginning the recordings. All traces represent the average response of > 50 cells from single coverslips. A, 3 min before beginning recordings, the cells were treated with 1 μg ml−1 gramicidin in Na/K-PSS solutions containing the Na+ concentrations indicated in the figure. Barium uptake was initiated by applying K-PSS containing 1 mm BaCl2 and 0.1 mm EGTA (the latter was included to chelate residual Ca2+). B, D447V cells were treated with ATP, Tg and gramicidin in Na/K-PSS solutions containing 5, 10, 20 and 40 mm Na+; in these experiments, gramicidin was applied 8 min before beginning the recordings. Reverse NCX activity was initiated by applying 0.1 mm CaCl2 in the same Na/K-PSS solution used for the pre-incubation (arrow labelled ‘Ca’). C, the procedure was the same as described for B, except that cells expressing the wild-type NCX1.1 were used. D, as in B, except that Δ(241–680) cells were used.
Figure 4
Figure 4. Ca2+ uptake by individual D447V, NCX1.1 or Δ(241–680) cells
Traces for several of the individual cells from the coverslips used for the experiment in 20/120 Na/K-PSS from Fig. 3. A, D447V cells; B, NCX1.1 cells; and C, Δ(241–680) cells.
Figure 5
Figure 5. Effect of elevated [Ca2+]i on NCX activity of cells expressing D447V
All traces reflect the average response of > 50 cells from single coverslips. A, cells expressing D447V were treated with ATP/Tg in Na-PSS/EGTA, and with gramicidin in 20/120 Na/K-PSS/EGTA, 10 and 8 min, respectively, before beginning recordings. At t = 30 s, 1 ml of 20/120 Na/K-PSS containing 0.2% DMSO or 5 μm Cl-CCP plus 1 μg ml−1 oligomycin was applied, as indicated by the arrow labelled ‘CO’. Four millilitres of 0.1 mm CaCl2 in 20/120 Na/K-PSS with 0.1% DMSO or 5 μm Cl-CCP were applied at 60 s, 20/120 Na/K-PSS with 0.1% DMSO or 5 μm Cl-CCP was applied at 240 s, and 0.1 mm CaCl2 with 0.1% DMSO or 5 μm Cl-CCP was re-applied at 300 s. B, the general protocol was similar to that for the Cl-CCP-treated cells in A. In this case, however, the experiment was run at room temperature rather than 37°C, 40/100 Na/K-PSS was used instead of 20/120 Na/K-PSS, and Cl-CCP was omitted from all solutions applied after 60 s. At 330 s, 40/100 Na/K-PSS and 0.3 mm EGTA was applied, and at 630 s, 0.1 mm CaCl2 in 40/100 Na/K-PSS was again applied. C, the general protocol was similar to that described for B, except that cells expressing the Δ(241–680) mutant were used. D, as in B and C except that cells expressing the wild-type NCX1.1 were used.
Figure 6
Figure 6. Changes in PIP2 associated with elevated [Ca2+]i
Cells expressing the D447V mutant were transfected with cDNA coding for PLCδ1PH-GFP. Forty-eight hours later, the distribution of PLCδ1PH-GFP was monitored during the solution changes described in Fig. 5. The cells were loaded with fura-2 to ensure that cytosolic Ca2+ buffering was equivalent to the experiments in Fig. 5B. The cells were then treated with ATP and Tg, with gramicidin in 40/100 Na/K-PSS, and the procedure described in the legend to Fig. 5B was followed, i.e. Cl-CCP and oligomycin were added at 30 s, 0.1 mm Ca2+ and Cl-CCP were applied at 60 s, and 0.3 mm EGTA was applied at approximately 120 s; the experiment was conducted at room temperature. The times given in the left column correspond to the time axis in Fig. 5B, i.e. the image labelled ‘Before’ was taken prior to the initiation of the experiment, the image at 120 s was taken just prior to the application of 0.3 mm EGTA, and images were subsequently taken at 195 and 300 s. A second application of Ca2+ (e.g. at 200 s) was not done in this experiment; in other experiments, we found that the second application of Ca2+ reversed the recovery process so that fluorescence again became cytosolic. The two cells shown are from the same coverslip. However, since their fluorescence intensities were different, the brightness and contrast for each cell was independently adjusted using the auto feature of the Adobe Photoshop CS program. The traces on the right side of each image show the intensity profiles along the white lines depicted in the top image, as determined using the Image J program.
Figure 7
Figure 7. Time course for activation and reversibility of NCX activity
A, cells expressing the D447V mutant were treated with ATP and Tg in Na-PSS/EGTA and with gramicidin (1 μg ml−1) in 5/140 Na/K-PSS 10 and 8 min, respectively, before beginning recordings. At t = 30 s in the figure, 4 ml of 40/100 Na/K-PSS was applied, and Ca2+ uptake was initiated 0.5, 1, 2 or 5 min later by applying 0.1 mm CaCl2 in 40/100 Na/K-PSS. Also shown is a control trace for Ca2+ uptake in 5/140 Na/K-PSS initiated at 30 s without exposure to 40/100 Na/K-PSS (▴, labelled ‘0’ in B). B, traces in A are superimposed; t = 0 in the figure refers to the time at which NCX activity was initiated. C, cells expressing the D447V mutant were treated with ATP and Tg in Na-PSS/EGTA and with gramicidin (1 μg ml−1) in 40/100 Na/K-PSS at 10 and 8 min, respectively, before beginning recordings. At t = 30 s in the figure, 5 ml of 5/140 Na/K-PSS/EGTA was applied, and Ca2+ uptake was measured 0.5, 1, 2 and 5 min later in 5/140 Na/K-PSS. Also shown is a control trace (▴, labelled ‘0’ in D) of Ca2+ uptake in 40/100 Na/K-PSS initiated at 30 s without exposure to 5/140 Na/K PSS. D, traces in A are superimposed; t = 0 refers to the time of initiation of Ca2+ uptake. All traces show the average response of > 50 cells from single coverslips.

Similar articles

Cited by

References

    1. Aharonovitz O, Zaun HC, Balla T, York JD, Orlowski J, Grinstein S. Intracellular pH regulation by Na+/H+ exchange requires phosphatidylinositol 4,5-bisphosphate. J Cell Biol. 2000;150:213–224. - PMC - PubMed
    1. Balla T. Phosphoinositide-derived messengers in endocrine signaling. J Endocrinol. 2006;188:135–153. - PubMed
    1. Blaustein MP, Lederer WJ. Sodium/calcium exchange: its physiological implications. Physiol Rev. 1999;79:763–854. - PubMed
    1. Chernysh O, Condrescu M, Reeves JP. Calcium-dependent regulation of calcium efflux by the cardiac sodium/calcium exchanger. Am J Physiol Cell Physiol. 2004;287:C797–C806. - PubMed
    1. Collins A, Somlyo AV, Hilgemann DW. The giant cardiac membrane patch method: stimulation of outward Na+–Ca2+ exchange current by MgATP. J Physiol. 1992;454:27–57. - PMC - PubMed

Publication types

LinkOut - more resources